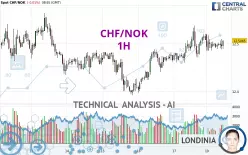
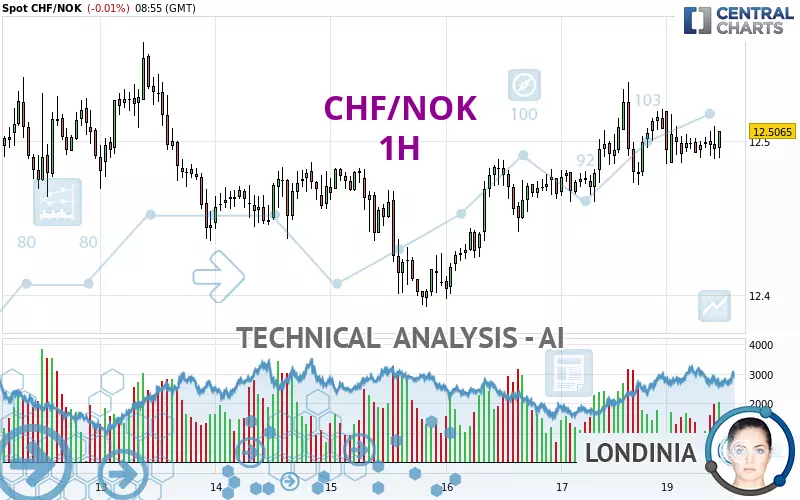
CHF/NOK - 1H - Technical analysis published on 01/20/2025 (GMT)
- 124
- 0
Click here for a new analysis!
- Timeframe : 1H
- - Analysis generated on
- Status : INVALID
Summary of the analysis

Additional analysis
Quotes
The CHF/NOK price is 12.5065 NOK. The price registered a decrease of -0.01% on the session and was between 12.4850 NOK and 12.5195 NOK. This implies that the price is at +0.17% from its lowest and at -0.10% from its highest.A study of price movements over other periods shows the following variations:
Near a new HIGH record (1st january)
Type : Bullish
Timeframe : Weekly
Near a new HIGH record (1 month)
Type : Bullish
Timeframe : Weekly
Technical
A technical analysis in 1H of this CHF/NOK chart shows a strongly bullish trend. The signals given by moving averages are 89.29% bullish. This strongly bullish trend seems to be running out of steam given the signals being given by short-term moving averages. An assessment of moving averages reveals several bearish and bullish signals:
Bearish trend reversal : Moving Average 20
Type : Bearish
Timeframe : 1 hour
Bullish price crossover with Moving Average 20
Type : Bullish
Timeframe : 1 hour
On the 18 technical indicators analysed, 5 are bullish, 8 are neutral and 5 are bearish. The Central Indicators scanner found this result concerning these indicators:
RSI indicator is back under 50
Type : Bearish
Timeframe : 1 hour
The Central Patterns scanner, which studies chart patterns, resistances and supports, has identified this signal:
Near support of channel
Type : Bullish
Timeframe : 1 hour
The Central Candlesticks scanner, specialised in Japanese candlesticks, did not identify any signals.
| S3 | S2 | S1 | Price | R1 | R2 | R3 | |
|---|---|---|---|---|---|---|---|
| ProTrendLines | 12.4357 | 12.4682 | 12.4865 | 12.5065 | 12.5101 | 12.5278 | 12.5512 |
| Change (%) | -0.57% | -0.31% | -0.16% | - | +0.03% | +0.17% | +0.36% |
| Change | -0.0708 | -0.0383 | -0.0200 | - | +0.0036 | +0.0213 | +0.0447 |
| Level | Intermediate | Major | Intermediate | - | Minor | Minor | Major |
Pivot points can also be used to set your price objectives. Here is the price situation in relation to pivot points:
| Pivot points | S3 | S2 | S1 | PP | R1 | R2 | R3 |
|---|---|---|---|---|---|---|---|
| Standard | 12.3882 | 12.4243 | 12.4660 | 12.5021 | 12.5438 | 12.5799 | 12.6216 |
| Camarilla | 12.4863 | 12.4934 | 12.5006 | 12.5077 | 12.5148 | 12.5220 | 12.5291 |
| Woodie | 12.3910 | 12.4257 | 12.4688 | 12.5035 | 12.5466 | 12.5813 | 12.6244 |
| Fibonacci | 12.4243 | 12.4540 | 12.4724 | 12.5021 | 12.5318 | 12.5502 | 12.5799 |
| Pivot points | S3 | S2 | S1 | PP | R1 | R2 | R3 |
|---|---|---|---|---|---|---|---|
| Standard | 12.2396 | 12.3160 | 12.4118 | 12.4882 | 12.5840 | 12.6604 | 12.7562 |
| Camarilla | 12.4604 | 12.4761 | 12.4919 | 12.5077 | 12.5235 | 12.5393 | 12.5551 |
| Woodie | 12.2494 | 12.3209 | 12.4216 | 12.4931 | 12.5938 | 12.6653 | 12.7660 |
| Fibonacci | 12.3160 | 12.3818 | 12.4224 | 12.4882 | 12.5540 | 12.5946 | 12.6604 |
| Pivot points | S3 | S2 | S1 | PP | R1 | R2 | R3 |
|---|---|---|---|---|---|---|---|
| Standard | 11.9952 | 12.2063 | 12.3755 | 12.5866 | 12.7558 | 12.9669 | 13.1361 |
| Camarilla | 12.4400 | 12.4749 | 12.5097 | 12.5446 | 12.5795 | 12.6143 | 12.6492 |
| Woodie | 11.9742 | 12.1958 | 12.3545 | 12.5761 | 12.7348 | 12.9564 | 13.1151 |
| Fibonacci | 12.2063 | 12.3516 | 12.4414 | 12.5866 | 12.7319 | 12.8217 | 12.9669 |
Numerical data
The following is the status of the technical indicators and moving averages at the time of publication of this technical analysis:
| RSI (14): | 52.52 | |
| MACD (12,26,9): | 0.0035 | |
| Directional Movement: | -1.4863 | |
| AROON (14): | -7.1429 | |
| DEMA (21): | 12.5020 | |
| Parabolic SAR (0,02-0,02-0,2): | 12.4727 | |
| Elder Ray (13): | -0.0022 | |
| Super Trend (3,10): | 12.4668 | |
| Zig ZAG (10): | 12.4983 | |
| VORTEX (21): | 0.9874 | |
| Stochastique (14,3,5): | 32.41 | |
| TEMA (21): | 12.4981 | |
| Williams %R (14): | -68.14 | |
| Chande Momentum Oscillator (20): | -0.0112 | |
| Repulse (5,40,3): | -0.0620 | |
| ROCnROLL: | -1 | |
| TRIX (15,9): | 0.0062 | |
| Courbe Coppock: | 0.06 |
| MA7: | 12.4737 | |
| MA20: | 12.5289 | |
| MA50: | 12.5365 | |
| MA100: | 12.5502 | |
| MAexp7: | 12.4976 | |
| MAexp20: | 12.4961 | |
| MAexp50: | 12.4857 | |
| MAexp100: | 12.4788 | |
| Price / MA7: | +0.26% | |
| Price / MA20: | -0.18% | |
| Price / MA50: | -0.24% | |
| Price / MA100: | -0.35% | |
| Price / MAexp7: | +0.07% | |
| Price / MAexp20: | +0.08% | |
| Price / MAexp50: | +0.17% | |
| Price / MAexp100: | +0.22% |
About author
Online


Add a comment
Comments
0 comments on the analysis CHF/NOK - 1H