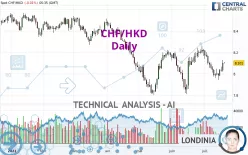
CHF/HKD - Daily - Technical analysis published on 07/20/2022 (GMT)
- 157
- 0
- Timeframe : Daily
- - Analysis generated on
- Status : NEUTRAL

Summary of the analysis

Additional analysis
Quotes
The CHF/HKD price is 8.1010 HKD. The price registered a decrease of -0.01% on the session and was traded between 8.0993 HKD and 8.1111 HKD over the period. The price is currently at +0.02% from its lowest and -0.12% from its highest.A study of price movements over other periods shows the following variations:
Near a new LOW record (5 years)
Type : Bearish
Timeframe : Weekly
Near a new LOW record (1 year)
Type : Bearish
Timeframe : Weekly
Near a new LOW record (1st january)
Type : Bearish
Timeframe : Weekly
Near a new HIGH record (1 month)
Type : Bullish
Timeframe : Weekly
Technical
A technical analysis in Daily of this CHF/HKD chart shows a slightly bearish trend. 53.57% of the signals given by moving averages are bearish. Caution: the slightly bullish signals currently given by short-term moving averages could cause a reversal of the trend. An assessment of moving averages reveals several bullish signals that could impact this trend:
Bullish trend reversal : adaptative moving average 20
Type : Bullish
Timeframe : Daily
Bullish trend reversal : adaptative moving average 50
Type : Bullish
Timeframe : Daily
An assessment of technical indicators does not currently provide any relevant information to suggest whether the signal given by the technical indicators is more bullish or bearish.
Central Indicators, the detector scanner for these technical indicators recently detected a signal:
Pivot points : price is over resistance 1
Type : Neutral
Timeframe : Weekly
Central Patterns, the market scanner focusing on chart patterns, resistances and supports found this result:
Near horizontal resistance
Type : Bearish
Timeframe : Daily
The Central Candlesticks scanner which studies Japanese candlesticks did not detect anything.
| S3 | S2 | S1 | Price | R1 | R2 | R3 | |
|---|---|---|---|---|---|---|---|
| ProTrendLines | 7.5279 | 7.6850 | 7.8529 | 8.1010 | 8.1143 | 8.2016 | 8.3795 |
| Change (%) | -7.07% | -5.14% | -3.06% | - | +0.16% | +1.24% | +3.44% |
| Change | -0.5731 | -0.4160 | -0.2481 | - | +0.0133 | +0.1006 | +0.2785 |
| Level | Major | Intermediate | Major | - | Intermediate | Major | Major |
Pivot points can also be used to set your price objectives. Here is the price situation in relation to pivot points:
| Pivot points | S3 | S2 | S1 | PP | R1 | R2 | R3 |
|---|---|---|---|---|---|---|---|
| Standard | 7.9283 | 7.9744 | 8.0382 | 8.0843 | 8.1481 | 8.1942 | 8.2580 |
| Camarilla | 8.0717 | 8.0818 | 8.0918 | 8.1019 | 8.1120 | 8.1221 | 8.1321 |
| Woodie | 7.9371 | 7.9788 | 8.0470 | 8.0887 | 8.1569 | 8.1986 | 8.2668 |
| Fibonacci | 7.9744 | 8.0164 | 8.0424 | 8.0843 | 8.1263 | 8.1523 | 8.1942 |
| Pivot points | S3 | S2 | S1 | PP | R1 | R2 | R3 |
|---|---|---|---|---|---|---|---|
| Standard | 7.8671 | 7.9041 | 7.9715 | 8.0085 | 8.0759 | 8.1129 | 8.1803 |
| Camarilla | 8.0102 | 8.0198 | 8.0293 | 8.0389 | 8.0485 | 8.0580 | 8.0676 |
| Woodie | 7.8823 | 7.9117 | 7.9867 | 8.0161 | 8.0911 | 8.1205 | 8.1955 |
| Fibonacci | 7.9041 | 7.9440 | 7.9686 | 8.0085 | 8.0484 | 8.0730 | 8.1129 |
| Pivot points | S3 | S2 | S1 | PP | R1 | R2 | R3 |
|---|---|---|---|---|---|---|---|
| Standard | 7.4757 | 7.6432 | 7.9291 | 8.0966 | 8.3825 | 8.5500 | 8.8359 |
| Camarilla | 8.0903 | 8.1319 | 8.1734 | 8.2150 | 8.2566 | 8.2981 | 8.3397 |
| Woodie | 7.5349 | 7.6728 | 7.9883 | 8.1262 | 8.4417 | 8.5796 | 8.8951 |
| Fibonacci | 7.6432 | 7.8164 | 7.9234 | 8.0966 | 8.2698 | 8.3768 | 8.5500 |
Numerical data
The following is the status of the technical indicators and moving averages at the time of publication of this technical analysis:
| RSI (14): | 53.27 | |
| MACD (12,26,9): | -0.0126 | |
| Directional Movement: | 3.5843 | |
| AROON (14): | -71.4286 | |
| DEMA (21): | 8.0582 | |
| Parabolic SAR (0,02-0,02-0,2): | 7.9449 | |
| Elder Ray (13): | 0.0399 | |
| Super Trend (3,10): | 7.9763 | |
| Zig ZAG (10): | 8.1026 | |
| VORTEX (21): | 0.9951 | |
| Stochastique (14,3,5): | 46.73 | |
| TEMA (21): | 8.0495 | |
| Williams %R (14): | -42.64 | |
| Chande Momentum Oscillator (20): | -0.0637 | |
| Repulse (5,40,3): | 0.6847 | |
| ROCnROLL: | -1 | |
| TRIX (15,9): | -0.0163 | |
| Courbe Coppock: | 3.39 |
| MA7: | 8.0365 | |
| MA20: | 8.1036 | |
| MA50: | 8.0717 | |
| MA100: | 8.1804 | |
| MAexp7: | 8.0613 | |
| MAexp20: | 8.0724 | |
| MAexp50: | 8.0990 | |
| MAexp100: | 8.1679 | |
| Price / MA7: | +0.80% | |
| Price / MA20: | -0.03% | |
| Price / MA50: | +0.36% | |
| Price / MA100: | -0.97% | |
| Price / MAexp7: | +0.49% | |
| Price / MAexp20: | +0.35% | |
| Price / MAexp50: | +0.02% | |
| Price / MAexp100: | -0.82% |
About author
Online


Add a comment
Comments
0 comments on the analysis CHF/HKD - Daily