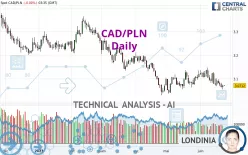
CAD/PLN - Daily - Technical analysis published on 06/23/2023 (GMT)
- 98
- 0
Click here for a new analysis!
- Timeframe : Daily
- - Analysis generated on
- Status : TARGET REACHED

Summary of the analysis

Additional analysis
Quotes
The CAD/PLN rating is 3.0712 PLN. The price has increased by +0.00% since the last closing with the lowest point at 3.0697 PLN and the highest point at 3.0736 PLN. The deviation from the price is +0.05% for the low point and -0.08% for the high point.Here is a more detailed summary of the historical variations registered by CAD/PLN:
Near a new LOW record (1 year)
Type : Bearish
Timeframe : Weekly
Near a new LOW record (1st january)
Type : Bearish
Timeframe : Weekly
Near a new HIGH record (1 month)
Type : Bullish
Timeframe : Weekly
Technical
Technical analysis of CAD/PLN in Daily shows a overall strongly bearish trend. 89.29% of the signals given by moving averages are bearish. The overall trend is supported by the strong bearish signals from short-term moving averages. The Central Indicators market scanner currently does not detect any result that concerns moving averages.
Technical indicators are bearish. There is still some doubt about the decline in the price.
But beware of excesses. The Central Indicators scanner currently detects this:
CCI indicator is oversold : under -100
Type : Neutral
Timeframe : Daily
Williams %R indicator is oversold : under -80
Type : Neutral
Timeframe : Daily
Central Patterns, the market scanner focusing on chart patterns, resistances and supports found this result:
Near resistance of channel
Type : Bearish
Timeframe : Daily
The Central Candlesticks scanner, specialised in Japanese candlesticks, did not identify any signals.
| S3 | S2 | S1 | Price | R1 | R2 | R3 | |
|---|---|---|---|---|---|---|---|
| ProTrendLines | 2.7110 | 2.9020 | 3.0148 | 3.0712 | 3.1324 | 3.1987 | 3.3436 |
| Change (%) | -11.73% | -5.51% | -1.84% | - | +1.99% | +4.15% | +8.87% |
| Change | -0.3602 | -0.1692 | -0.0564 | - | +0.0612 | +0.1275 | +0.2724 |
| Level | Major | Minor | Major | - | Major | Major | Major |
To determine price objectives, it is also possible to use the pivot points. Here is the price position in relation to pivot points:
| Pivot points | S3 | S2 | S1 | PP | R1 | R2 | R3 |
|---|---|---|---|---|---|---|---|
| Standard | 3.0394 | 3.0473 | 3.0593 | 3.0672 | 3.0792 | 3.0871 | 3.0991 |
| Camarilla | 3.0658 | 3.0677 | 3.0695 | 3.0713 | 3.0731 | 3.0750 | 3.0768 |
| Woodie | 3.0415 | 3.0483 | 3.0614 | 3.0682 | 3.0813 | 3.0881 | 3.1012 |
| Fibonacci | 3.0473 | 3.0549 | 3.0596 | 3.0672 | 3.0748 | 3.0795 | 3.0871 |
| Pivot points | S3 | S2 | S1 | PP | R1 | R2 | R3 |
|---|---|---|---|---|---|---|---|
| Standard | 3.0044 | 3.0368 | 3.0645 | 3.0969 | 3.1246 | 3.1570 | 3.1847 |
| Camarilla | 3.0757 | 3.0812 | 3.0867 | 3.0922 | 3.0977 | 3.1032 | 3.1087 |
| Woodie | 3.0021 | 3.0356 | 3.0622 | 3.0957 | 3.1223 | 3.1558 | 3.1824 |
| Fibonacci | 3.0368 | 3.0598 | 3.0739 | 3.0969 | 3.1199 | 3.1340 | 3.1570 |
| Pivot points | S3 | S2 | S1 | PP | R1 | R2 | R3 |
|---|---|---|---|---|---|---|---|
| Standard | 2.9602 | 2.9986 | 3.0596 | 3.0980 | 3.1590 | 3.1974 | 3.2584 |
| Camarilla | 3.0932 | 3.1023 | 3.1114 | 3.1205 | 3.1296 | 3.1387 | 3.1478 |
| Woodie | 2.9714 | 3.0043 | 3.0708 | 3.1037 | 3.1702 | 3.2031 | 3.2696 |
| Fibonacci | 2.9986 | 3.0366 | 3.0601 | 3.0980 | 3.1360 | 3.1595 | 3.1974 |
Numerical data
The following is the status of the technical indicators and moving averages at the time of publication of this technical analysis:
| RSI (14): | 43.32 | |
| MACD (12,26,9): | -0.0088 | |
| Directional Movement: | -2.3943 | |
| AROON (14): | -71.4285 | |
| DEMA (21): | 3.0799 | |
| Parabolic SAR (0,02-0,02-0,2): | 3.1063 | |
| Elder Ray (13): | -0.0134 | |
| Super Trend (3,10): | 3.0450 | |
| Zig ZAG (10): | 3.0714 | |
| VORTEX (21): | 0.9924 | |
| Stochastique (14,3,5): | 12.33 | |
| TEMA (21): | 3.0775 | |
| Williams %R (14): | -82.56 | |
| Chande Momentum Oscillator (20): | -0.0640 | |
| Repulse (5,40,3): | -0.1719 | |
| ROCnROLL: | 2 | |
| TRIX (15,9): | -0.0170 | |
| Courbe Coppock: | 2.32 |
| MA7: | 3.0767 | |
| MA20: | 3.0987 | |
| MA50: | 3.0935 | |
| MA100: | 3.1618 | |
| MAexp7: | 3.0777 | |
| MAexp20: | 3.0897 | |
| MAexp50: | 3.1089 | |
| MAexp100: | 3.1580 | |
| Price / MA7: | -0.18% | |
| Price / MA20: | -0.89% | |
| Price / MA50: | -0.72% | |
| Price / MA100: | -2.87% | |
| Price / MAexp7: | -0.21% | |
| Price / MAexp20: | -0.60% | |
| Price / MAexp50: | -1.21% | |
| Price / MAexp100: | -2.75% |
About author
Online


Add a comment
Comments
0 comments on the analysis CAD/PLN - Daily