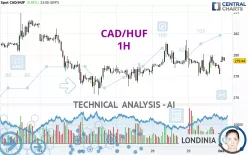
CAD/HUF - 1H - Technical analysis published on 12/01/2024 (GMT)
- 151
- 0
- Timeframe : 1H
- - Analysis generated on
- Status : NEUTRAL

Summary of the analysis

Additional analysis
Quotes
The CAD/HUF price is 279.44 HUF. The price registered an increase of +0.45% on the session with the lowest point at 279.30 HUF and the highest point at 279.85 HUF. The deviation from the price is +0.05% for the low point and -0.15% for the high point.A bearish opening was detected by the Central Gaps scanner. Sellers are trying to impose a bearish trend in the very short term.
Bearish opening
Type : Bearish
Timeframe : Openning
Here is a more detailed summary of the historical variations registered by CAD/HUF:
Near a new HIGH record (1 year)
Type : Bullish
Timeframe : Weekly
Near a new HIGH record (1st january)
Type : Bullish
Timeframe : Weekly
Near a new LOW record (1 month)
Type : Bearish
Timeframe : Weekly
Technical
Technical analysis of CAD/HUF in 1H shows an overall slightly bearish trend. 50.00% of the signals given by moving averages are bearish. Caution: the slightly bullish signals currently given by short-term moving averages could cause a reversal of the trend. The Central Indicators scanner does not detect any result on moving averages that would impact this trend.
In fact, Central Analyzer took into account 18 technical indicators and the result was as follows: 5 are bullish, 5 are neutral and 8 are bearish. Caution: the Central Indicators scanner currently detects an excess:
CCI indicator is oversold : under -100
Type : Neutral
Timeframe : 1 hour
Williams %R indicator is oversold : under -80
Type : Neutral
Timeframe : 1 hour
MACD crosses DOWN its Moving Average
Type : Bearish
Timeframe : 1 hour
Price is back under the pivot point
Type : Bearish
Timeframe : Weekly
An analysis of the price chart with the Central Patterns scanner (detector of chart patterns and resistances and supports) shows several results that can have an impact on the price change:
Near horizontal support
Type : Bullish
Timeframe : 1 hour
Near support of triangle
Type : Bullish
Timeframe : 1 hour
Support of channel is broken
Type : Bearish
Timeframe : 1 hour
The Central Candlesticks scanner, specialised in Japanese candlesticks, did not identify any signals.
| S3 | S2 | S1 | Price | R1 | R2 | R3 | |
|---|---|---|---|---|---|---|---|
| ProTrendLines | 276.21 | 277.09 | 278.02 | 279.44 | 280.06 | 281.19 | 282.46 |
| Change (%) | -1.16% | -0.84% | -0.51% | - | +0.22% | +0.63% | +1.08% |
| Change | -3.23 | -2.35 | -1.42 | - | +0.62 | +1.75 | +3.02 |
| Level | Intermediate | Minor | Major | - | Intermediate | Intermediate | Minor |
Pivot points can also be used to set your price objectives. Here is the price situation in relation to pivot points:
| Pivot points | S3 | S2 | S1 | PP | R1 | R2 | R3 |
|---|---|---|---|---|---|---|---|
| Standard | 274.63 | 276.32 | 277.26 | 278.95 | 279.89 | 281.58 | 282.52 |
| Camarilla | 277.48 | 277.72 | 277.96 | 278.20 | 278.44 | 278.68 | 278.92 |
| Woodie | 274.26 | 276.13 | 276.89 | 278.76 | 279.52 | 281.39 | 282.15 |
| Fibonacci | 276.32 | 277.33 | 277.95 | 278.95 | 279.96 | 280.58 | 281.58 |
| Pivot points | S3 | S2 | S1 | PP | R1 | R2 | R3 |
|---|---|---|---|---|---|---|---|
| Standard | 269.20 | 272.71 | 275.45 | 278.96 | 281.70 | 285.21 | 287.95 |
| Camarilla | 276.48 | 277.05 | 277.63 | 278.20 | 278.77 | 279.35 | 279.92 |
| Woodie | 268.83 | 272.52 | 275.08 | 278.77 | 281.33 | 285.02 | 287.58 |
| Fibonacci | 272.71 | 275.09 | 276.57 | 278.96 | 281.34 | 282.82 | 285.21 |
| Pivot points | S3 | S2 | S1 | PP | R1 | R2 | R3 |
|---|---|---|---|---|---|---|---|
| Standard | 254.80 | 261.77 | 269.98 | 276.95 | 285.16 | 292.13 | 300.34 |
| Camarilla | 274.03 | 275.42 | 276.81 | 278.20 | 279.59 | 280.98 | 282.38 |
| Woodie | 255.43 | 262.08 | 270.61 | 277.26 | 285.79 | 292.44 | 300.97 |
| Fibonacci | 261.77 | 267.57 | 271.15 | 276.95 | 282.75 | 286.33 | 292.13 |
Numerical data
The following is the status of the technical indicators and moving averages at the time of publication of this technical analysis:
| RSI (14): | 41.30 | |
| MACD (12,26,9): | -0.1300 | |
| Directional Movement: | 1.99 | |
| AROON (14): | -21.43 | |
| DEMA (21): | 278.83 | |
| Parabolic SAR (0,02-0,02-0,2): | 279.66 | |
| Elder Ray (13): | -0.32 | |
| Super Trend (3,10): | 280.38 | |
| Zig ZAG (10): | 278.20 | |
| VORTEX (21): | 0.9600 | |
| Stochastique (14,3,5): | 31.40 | |
| TEMA (21): | 278.70 | |
| Williams %R (14): | -90.82 | |
| Chande Momentum Oscillator (20): | -1.23 | |
| Repulse (5,40,3): | -0.4200 | |
| ROCnROLL: | 2 | |
| TRIX (15,9): | 0.0000 | |
| Courbe Coppock: | 0.13 |
| MA7: | 279.56 | |
| MA20: | 276.04 | |
| MA50: | 270.73 | |
| MA100: | 266.45 | |
| MAexp7: | 278.79 | |
| MAexp20: | 278.98 | |
| MAexp50: | 279.05 | |
| MAexp100: | 278.98 | |
| Price / MA7: | -0.04% | |
| Price / MA20: | +1.23% | |
| Price / MA50: | +3.22% | |
| Price / MA100: | +4.88% | |
| Price / MAexp7: | +0.23% | |
| Price / MAexp20: | +0.16% | |
| Price / MAexp50: | +0.14% | |
| Price / MAexp100: | +0.16% |
About author
Online


Add a comment
Comments
0 comments on the analysis CAD/HUF - 1H