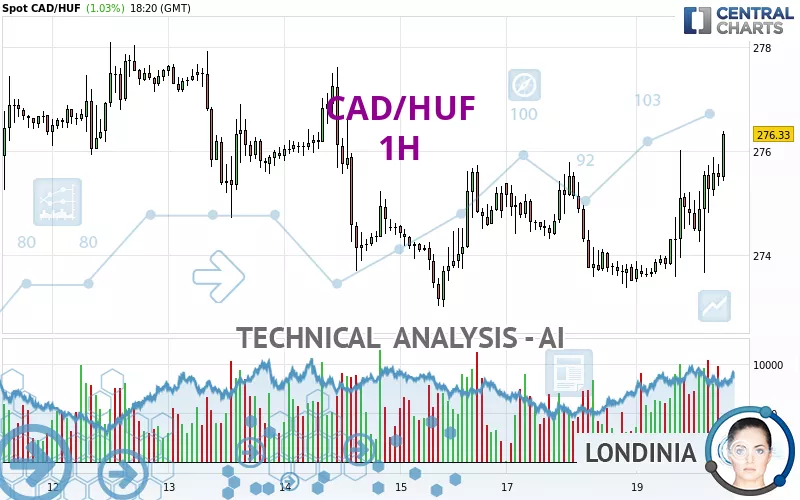
CAD/HUF - 1H - Technical analysis published on 11/19/2024 (GMT)
- 100
- 0
Click here for a new analysis!
- Timeframe : 1H
- - Analysis generated on
- Status : TARGET REACHED
Summary of the analysis

Additional analysis
Quotes
CAD/HUF rating 276.32 HUF. On the day, this instrument gained +1.03% with the lowest point at 273.49 HUF and the highest point at 276.38 HUF. The deviation from the price is +1.03% for the low point and -0.02% for the high point.The Central Gaps scanner detects a bullish opening marking the presence of buyers ahead of sellers at the opening but not sufficiently marked to allow the price to register a quotation gap.
Bullish opening
Type : Bullish
Timeframe : Openning
So that you have an overall view of the price change, here is a table showing the variations over several periods:
Near a new HIGH record (1 year)
Type : Bullish
Timeframe : Weekly
Near a new HIGH record (1st january)
Type : Bullish
Timeframe : Weekly
Near a new LOW record (1 month)
Type : Bearish
Timeframe : Weekly
Technical
Technical analysis of this 1H chart of CAD/HUF indicates that the overall trend is bullish. 67.86% of the signals given by moving averages are bullish. This bullish trend is supported by the strong bullish signals given by short-term moving averages. The Central Indicators market scanner is currently detecting a bullish signal that could impact this trend:
Moving Average bullish crossovers : AMA20 & AMA50
Type : Bullish
Timeframe : 1 hour
In fact, 15 technical indicators on 18 studied are currently positioned bullish. But beware of excesses. The Central Indicators scanner currently detects this:
RSI indicator is overbought : over 70
Type : Neutral
Timeframe : 1 hour
CCI indicator is overbought : over 100
Type : Neutral
Timeframe : 1 hour
Williams %R indicator is overbought : over -20
Type : Neutral
Timeframe : 1 hour
Pivot points : price is over resistance 1
Type : Neutral
Timeframe : 1 hour
Parabolic SAR indicator bullish reversal
Type : Bullish
Timeframe : 1 hour
An analysis of the price chart with the Central Patterns scanner (detector of chart patterns and resistances and supports) shows several results that can have an impact on the price change:
Near horizontal resistance
Type : Bearish
Timeframe : 1 hour
Resistance of channel is broken
Type : Bullish
Timeframe : 1 hour
No result was found by the Central Candlesticks scanner on Japanese candlesticks.
| S3 | S2 | S1 | Price | R1 | R2 | R3 | |
|---|---|---|---|---|---|---|---|
| ProTrendLines | 273.57 | 274.71 | 275.78 | 276.32 | 276.87 | 277.56 | 300.10 |
| Change (%) | -1.00% | -0.58% | -0.20% | - | +0.20% | +0.45% | +8.61% |
| Change | -2.75 | -1.61 | -0.54 | - | +0.55 | +1.24 | +23.78 |
| Level | Major | Intermediate | Intermediate | - | Minor | Major | Minor |
To determine price objectives, it is also possible to use the pivot points. Here is the price position in relation to pivot points:
| Pivot points | S3 | S2 | S1 | PP | R1 | R2 | R3 |
|---|---|---|---|---|---|---|---|
| Standard | 270.22 | 271.80 | 272.65 | 274.23 | 275.08 | 276.66 | 277.51 |
| Camarilla | 272.84 | 273.07 | 273.29 | 273.51 | 273.73 | 273.96 | 274.18 |
| Woodie | 269.87 | 271.62 | 272.30 | 274.05 | 274.73 | 276.48 | 277.16 |
| Fibonacci | 271.80 | 272.73 | 273.30 | 274.23 | 275.16 | 275.73 | 276.66 |
| Pivot points | S3 | S2 | S1 | PP | R1 | R2 | R3 |
|---|---|---|---|---|---|---|---|
| Standard | 266.99 | 269.87 | 272.35 | 275.23 | 277.71 | 280.59 | 283.07 |
| Camarilla | 273.37 | 273.86 | 274.35 | 274.84 | 275.33 | 275.82 | 276.31 |
| Woodie | 266.80 | 269.77 | 272.16 | 275.13 | 277.52 | 280.49 | 282.88 |
| Fibonacci | 269.87 | 271.91 | 273.18 | 275.23 | 277.27 | 278.54 | 280.59 |
| Pivot points | S3 | S2 | S1 | PP | R1 | R2 | R3 |
|---|---|---|---|---|---|---|---|
| Standard | 256.80 | 260.07 | 264.72 | 267.99 | 272.64 | 275.91 | 280.56 |
| Camarilla | 267.19 | 267.92 | 268.64 | 269.37 | 270.10 | 270.82 | 271.55 |
| Woodie | 257.49 | 260.42 | 265.41 | 268.34 | 273.33 | 276.26 | 281.25 |
| Fibonacci | 260.07 | 263.10 | 264.97 | 267.99 | 271.02 | 272.89 | 275.91 |
Numerical data
The following are the details of the technical indicators and moving averages that were collected to generate this technical analysis:
| RSI (14): | 65.55 | |
| MACD (12,26,9): | 0.3600 | |
| Directional Movement: | 5.82 | |
| AROON (14): | 7.14 | |
| DEMA (21): | 275.22 | |
| Parabolic SAR (0,02-0,02-0,2): | 273.65 | |
| Elder Ray (13): | 0.64 | |
| Super Trend (3,10): | 273.49 | |
| Zig ZAG (10): | 276.00 | |
| VORTEX (21): | 1.1400 | |
| Stochastique (14,3,5): | 86.16 | |
| TEMA (21): | 275.68 | |
| Williams %R (14): | -1.87 | |
| Chande Momentum Oscillator (20): | 2.32 | |
| Repulse (5,40,3): | 0.4300 | |
| ROCnROLL: | 1 | |
| TRIX (15,9): | 0.0100 | |
| Courbe Coppock: | 1.20 |
| MA7: | 275.57 | |
| MA20: | 272.09 | |
| MA50: | 267.88 | |
| MA100: | 265.42 | |
| MAexp7: | 275.47 | |
| MAexp20: | 274.80 | |
| MAexp50: | 274.62 | |
| MAexp100: | 274.72 | |
| Price / MA7: | +0.27% | |
| Price / MA20: | +1.55% | |
| Price / MA50: | +3.15% | |
| Price / MA100: | +4.11% | |
| Price / MAexp7: | +0.31% | |
| Price / MAexp20: | +0.55% | |
| Price / MAexp50: | +0.62% | |
| Price / MAexp100: | +0.58% |
About author
Online


Add a comment
Comments
0 comments on the analysis CAD/HUF - 1H