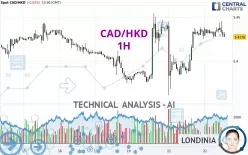
CAD/HKD - 1H - Technical analysis published on 01/22/2025 (GMT)
- 121
- 0
Click here for a new analysis!
- Timeframe : 1H
- - Analysis generated on
- Status : INVALID

Summary of the analysis

Additional analysis
Quotes
The CAD/HKD rating is 5.4276 HKD. The price registered a decrease of -0.02% on the session with the lowest point at 5.4266 HKD and the highest point at 5.4451 HKD. The deviation from the price is +0.02% for the low point and -0.32% for the high point.A study of price movements over other periods shows the following variations:
Near a new LOW record (5 years)
Type : Bearish
Timeframe : Weekly
Near a new LOW record (1 year)
Type : Bearish
Timeframe : Weekly
Near a new LOW record (1st january)
Type : Bearish
Timeframe : Weekly
Near a new LOW record (1 month)
Type : Bearish
Timeframe : Weekly
Technical
Technical analysis of CAD/HKD in 1H shows an overall bullish trend. 78.57% of the signals given by moving averages are bullish. Caution: the neutral signals currently given by the short-term moving averages indicate that this bullish trend is showing signs of running out of steam. The Central Indicators market scanner is currently detecting several bearish signals that could impact this trend:
Bearish trend reversal : Moving Average 20
Type : Bearish
Timeframe : 1 hour
Bearish price crossover with adaptative moving average 20
Type : Bearish
Timeframe : 1 hour
The technical indicators are generally neutral. They do not provide relevant information on the direction of future price movements.
Caution: the Central Indicators scanner currently detects an excess:
CCI indicator is oversold : under -100
Type : Neutral
Timeframe : 1 hour
Williams %R indicator is oversold : under -80
Type : Neutral
Timeframe : 1 hour
Pivot points : price is over resistance 1
Type : Neutral
Timeframe : Weekly
Central Patterns, the scanner specializing in chart patterns, did not identify any signals.
Central Candlesticks, the scanner specialised in Japanese candlesticks, detects a bullish signal that could support the hypothesis of a small rebound in the very short term:
Bullish harami
Type : Bullish
Timeframe : 1 hour
| S3 | S2 | S1 | Price | R1 | R2 | R3 | |
|---|---|---|---|---|---|---|---|
| ProTrendLines | 5.3891 | 5.4030 | 5.4217 | 5.4276 | 5.4440 | 5.4547 | 5.5761 |
| Change (%) | -0.71% | -0.45% | -0.11% | - | +0.30% | +0.50% | +2.74% |
| Change | -0.0385 | -0.0246 | -0.0059 | - | +0.0164 | +0.0271 | +0.1485 |
| Level | Intermediate | Minor | Intermediate | - | Intermediate | Minor | Minor |
Pivot points can also be used to set your price objectives. Here is the price situation in relation to pivot points:
| Pivot points | S3 | S2 | S1 | PP | R1 | R2 | R3 |
|---|---|---|---|---|---|---|---|
| Standard | 5.2945 | 5.3278 | 5.3783 | 5.4116 | 5.4621 | 5.4954 | 5.5459 |
| Camarilla | 5.4059 | 5.4135 | 5.4212 | 5.4289 | 5.4366 | 5.4443 | 5.4520 |
| Woodie | 5.3032 | 5.3321 | 5.3870 | 5.4159 | 5.4708 | 5.4997 | 5.5546 |
| Fibonacci | 5.3278 | 5.3598 | 5.3796 | 5.4116 | 5.4436 | 5.4634 | 5.4954 |
| Pivot points | S3 | S2 | S1 | PP | R1 | R2 | R3 |
|---|---|---|---|---|---|---|---|
| Standard | 5.2854 | 5.3301 | 5.3544 | 5.3991 | 5.4234 | 5.4681 | 5.4924 |
| Camarilla | 5.3596 | 5.3660 | 5.3723 | 5.3786 | 5.3849 | 5.3913 | 5.3976 |
| Woodie | 5.2751 | 5.3250 | 5.3441 | 5.3940 | 5.4131 | 5.4630 | 5.4821 |
| Fibonacci | 5.3301 | 5.3565 | 5.3728 | 5.3991 | 5.4255 | 5.4418 | 5.4681 |
| Pivot points | S3 | S2 | S1 | PP | R1 | R2 | R3 |
|---|---|---|---|---|---|---|---|
| Standard | 5.1344 | 5.2532 | 5.3267 | 5.4455 | 5.5190 | 5.6378 | 5.7113 |
| Camarilla | 5.3474 | 5.3651 | 5.3827 | 5.4003 | 5.4179 | 5.4356 | 5.4532 |
| Woodie | 5.1119 | 5.2419 | 5.3042 | 5.4342 | 5.4965 | 5.6265 | 5.6888 |
| Fibonacci | 5.2532 | 5.3266 | 5.3720 | 5.4455 | 5.5189 | 5.5643 | 5.6378 |
Numerical data
The following are the details of the technical indicators and moving averages that were collected to generate this technical analysis:
| RSI (14): | 54.98 | |
| MACD (12,26,9): | 0.0051 | |
| Directional Movement: | 1.9050 | |
| AROON (14): | 85.7143 | |
| DEMA (21): | 5.4368 | |
| Parabolic SAR (0,02-0,02-0,2): | 5.4241 | |
| Elder Ray (13): | -0.0006 | |
| Super Trend (3,10): | 5.4175 | |
| Zig ZAG (10): | 5.4301 | |
| VORTEX (21): | 1.1034 | |
| Stochastique (14,3,5): | 27.25 | |
| TEMA (21): | 5.4363 | |
| Williams %R (14): | -81.62 | |
| Chande Momentum Oscillator (20): | -0.0029 | |
| Repulse (5,40,3): | -0.1692 | |
| ROCnROLL: | -1 | |
| TRIX (15,9): | 0.0175 | |
| Courbe Coppock: | 0.03 |
| MA7: | 5.4210 | |
| MA20: | 5.4101 | |
| MA50: | 5.4694 | |
| MA100: | 5.5755 | |
| MAexp7: | 5.4320 | |
| MAexp20: | 5.4295 | |
| MAexp50: | 5.4204 | |
| MAexp100: | 5.4152 | |
| Price / MA7: | +0.12% | |
| Price / MA20: | +0.32% | |
| Price / MA50: | -0.76% | |
| Price / MA100: | -2.65% | |
| Price / MAexp7: | -0.08% | |
| Price / MAexp20: | -0.03% | |
| Price / MAexp50: | +0.13% | |
| Price / MAexp100: | +0.23% |
About author
Online


Add a comment
Comments
0 comments on the analysis CAD/HKD - 1H