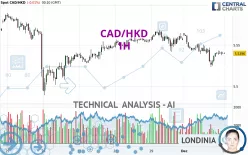
CAD/HKD - 1H - Technical analysis published on 12/03/2024 (GMT)
- 158
- 0
Click here for a new analysis!
- Timeframe : 1H
- - Analysis generated on
- Status : LEVEL MAINTAINED

Summary of the analysis

Additional analysis
Quotes
CAD/HKD rating 5.5396 HKD. The price is lower by -0.01% since the last closing with the lowest point at 5.5390 HKD and the highest point at 5.5408 HKD. The deviation from the price is +0.01% for the low point and -0.02% for the high point.A bullish opening was detected by the Central Gaps scanner. Buyers are trying to impose a bullish momentum in the very short term.
Bullish opening
Type : Bullish
Timeframe : Openning
Here is a more detailed summary of the historical variations registered by CAD/HKD:
Near a new LOW record (5 years)
Type : Bearish
Timeframe : Weekly
Near a new LOW record (1 year)
Type : Bearish
Timeframe : Weekly
Near a new LOW record (1st january)
Type : Bearish
Timeframe : Weekly
Near a new HIGH record (1 month)
Type : Bullish
Timeframe : Weekly
Technical
Technical analysis of this 1H chart of CAD/HKD indicates that the overall trend is bearish. 78.57% of the signals given by moving averages are bearish. This bearish trend is supported by the strong bearish signals given by short-term moving averages. There is no crossing of moving average by the price or crossing of moving averages between themselves.
In fact, according to the parameters integrated into the Central Analyzer system, 10 technical indicators out of 18 analysed are currently bullish. The Central Indicators scanner found this result concerning these indicators:
Price is back under the pivot point
Type : Bearish
Timeframe : Weekly
The Central Patterns scanner, which studies chart patterns, resistances and supports, has identified these signals:
Near horizontal support
Type : Bullish
Timeframe : 1 hour
Support of channel is broken
Type : Bearish
Timeframe : 1 hour
The Central Candlesticks scanner, specialised in Japanese candlesticks, did not identify any signals.
| S3 | S2 | S1 | Price | R1 | R2 | R3 | |
|---|---|---|---|---|---|---|---|
| ProTrendLines | 5.4891 | 5.5016 | 5.5205 | 5.5396 | 5.5520 | 5.5679 | 5.5790 |
| Change (%) | -0.91% | -0.69% | -0.34% | - | +0.22% | +0.51% | +0.71% |
| Change | -0.0505 | -0.0380 | -0.0191 | - | +0.0124 | +0.0283 | +0.0394 |
| Level | Intermediate | Minor | Major | - | Major | Intermediate | Minor |
Attention could also be paid to pivot points to set price objectives:
| Pivot points | S3 | S2 | S1 | PP | R1 | R2 | R3 |
|---|---|---|---|---|---|---|---|
| Standard | 5.4797 | 5.5014 | 5.5207 | 5.5424 | 5.5617 | 5.5834 | 5.6027 |
| Camarilla | 5.5286 | 5.5324 | 5.5361 | 5.5399 | 5.5437 | 5.5474 | 5.5512 |
| Woodie | 5.4784 | 5.5008 | 5.5194 | 5.5418 | 5.5604 | 5.5828 | 5.6014 |
| Fibonacci | 5.5014 | 5.5171 | 5.5268 | 5.5424 | 5.5581 | 5.5678 | 5.5834 |
| Pivot points | S3 | S2 | S1 | PP | R1 | R2 | R3 |
|---|---|---|---|---|---|---|---|
| Standard | 5.4014 | 5.4452 | 5.5008 | 5.5446 | 5.6002 | 5.6440 | 5.6996 |
| Camarilla | 5.5290 | 5.5381 | 5.5472 | 5.5563 | 5.5654 | 5.5745 | 5.5836 |
| Woodie | 5.4072 | 5.4482 | 5.5066 | 5.5476 | 5.6060 | 5.6470 | 5.7054 |
| Fibonacci | 5.4452 | 5.4832 | 5.5067 | 5.5446 | 5.5826 | 5.6061 | 5.6440 |
| Pivot points | S3 | S2 | S1 | PP | R1 | R2 | R3 |
|---|---|---|---|---|---|---|---|
| Standard | 5.3542 | 5.4216 | 5.4890 | 5.5564 | 5.6238 | 5.6912 | 5.7586 |
| Camarilla | 5.5192 | 5.5316 | 5.5439 | 5.5563 | 5.5687 | 5.5810 | 5.5934 |
| Woodie | 5.3541 | 5.4216 | 5.4889 | 5.5564 | 5.6237 | 5.6912 | 5.7585 |
| Fibonacci | 5.4216 | 5.4731 | 5.5049 | 5.5564 | 5.6079 | 5.6397 | 5.6912 |
Numerical data
The following is the status of the technical indicators and moving averages at the time of publication of this technical analysis:
| RSI (14): | 47.77 | |
| MACD (12,26,9): | -0.0029 | |
| Directional Movement: | -6.1027 | |
| AROON (14): | -35.7142 | |
| DEMA (21): | 5.5370 | |
| Parabolic SAR (0,02-0,02-0,2): | 5.5258 | |
| Elder Ray (13): | 0.0005 | |
| Super Trend (3,10): | 5.5496 | |
| Zig ZAG (10): | 5.5412 | |
| VORTEX (21): | 0.9694 | |
| Stochastique (14,3,5): | 64.08 | |
| TEMA (21): | 5.5367 | |
| Williams %R (14): | -35.06 | |
| Chande Momentum Oscillator (20): | -0.0032 | |
| Repulse (5,40,3): | 0.0721 | |
| ROCnROLL: | -1 | |
| TRIX (15,9): | -0.0108 | |
| Courbe Coppock: | 0.21 |
| MA7: | 5.5468 | |
| MA20: | 5.5631 | |
| MA50: | 5.6236 | |
| MA100: | 5.6676 | |
| MAexp7: | 5.5396 | |
| MAexp20: | 5.5413 | |
| MAexp50: | 5.5460 | |
| MAexp100: | 5.5483 | |
| Price / MA7: | -0.13% | |
| Price / MA20: | -0.42% | |
| Price / MA50: | -1.49% | |
| Price / MA100: | -2.26% | |
| Price / MAexp7: | -0% | |
| Price / MAexp20: | -0.03% | |
| Price / MAexp50: | -0.12% | |
| Price / MAexp100: | -0.16% |
About author
Online


Add a comment
Comments
0 comments on the analysis CAD/HKD - 1H