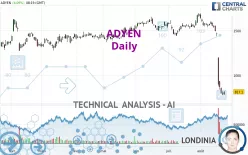
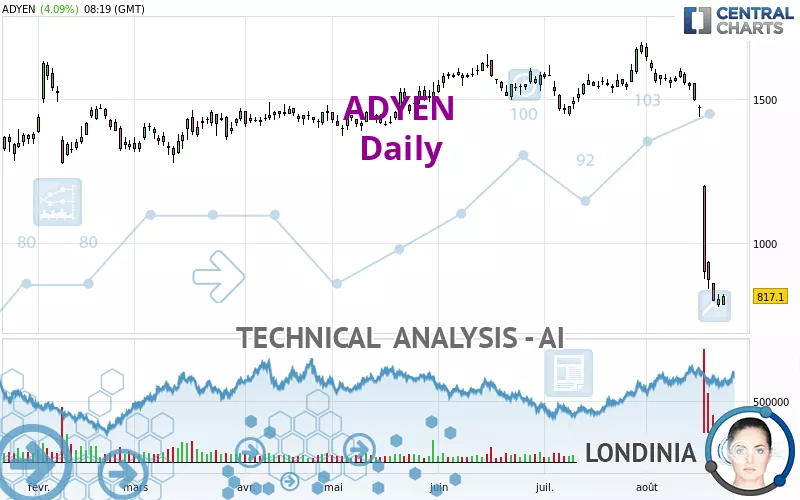
ADYEN - Daily - Technical analysis published on 08/23/2023 (GMT)
- 215
- 0
Click here for a new analysis!
- Timeframe : Daily
- - Analysis generated on
- Status : TARGET REACHED
Summary of the analysis

Additional analysis
Quotes
The ADYEN rating is 817.1 EUR. The price registered an increase of +4.09% on the session with the lowest point at 786.0 EUR and the highest point at 821.0 EUR. The deviation from the price is +3.96% for the low point and -0.48% for the high point.A bullish opening was detected by the Central Gaps scanner. Buyers are trying to impose a bullish momentum in the very short term.
Bullish opening
Type : Bullish
Timeframe : Openning
Here is a more detailed summary of the historical variations registered by ADYEN:
Near a new LOW record (1 year)
Type : Bearish
Timeframe : Weekly
Near a new LOW record (1st january)
Type : Bearish
Timeframe : Weekly
Near a new LOW record (1 month)
Type : Bearish
Timeframe : Weekly
Abnormal volumes on ADYEN were detected by the Central Volumes scanner:
Abnormal volumes
Timeframe : 5 days
Technical
Technical analysis of ADYEN in Daily shows a overall strongly bearish trend. 89.29% of the signals given by moving averages are bearish. This strongly bearish trend is supported by the strong bearish signals given by short-term moving averages. The Central Indicators scanner does not detect any result on moving averages that would impact this trend.
In fact, according to the parameters integrated into the Central Analyzer system, 12 technical indicators out of 18 analysed are currently bearish. But beware of excesses. The Central Indicators scanner currently detects this:
RSI indicator is oversold : under 20
Type : Neutral
Timeframe : Daily
CCI indicator is oversold : under -100
Type : Neutral
Timeframe : Daily
Williams %R indicator is oversold : under -80
Type : Neutral
Timeframe : Daily
Pivot points : price is over resistance 1
Type : Neutral
Timeframe : Daily
The analysis of the price chart with Central Patterns scanners does not return any result.
The Central Candlesticks scanner, specialised in Japanese candlesticks, did not identify any signals.
| S1 | Price | R1 | R2 | R3 | |
|---|---|---|---|---|---|
| ProTrendLines | 682.6 | 817.1 | 1,282.5 | 1,463.4 | 1,544.2 |
| Change (%) | -16.46% | - | +56.96% | +79.10% | +88.99% |
| Change | -134.5 | - | +465.4 | +646.3 | +727.1 |
| Level | Intermediate | - | Intermediate | Minor | Intermediate |
Attention could also be paid to pivot points to set price objectives:
| Pivot points | S3 | S2 | S1 | PP | R1 | R2 | R3 |
|---|---|---|---|---|---|---|---|
| Standard | 723.1 | 750.3 | 767.6 | 794.8 | 812.1 | 839.3 | 856.6 |
| Camarilla | 772.8 | 776.8 | 780.9 | 785.0 | 789.1 | 793.2 | 797.2 |
| Woodie | 718.3 | 747.8 | 762.8 | 792.3 | 807.3 | 836.8 | 851.8 |
| Fibonacci | 750.3 | 767.3 | 777.8 | 794.8 | 811.8 | 822.3 | 839.3 |
| Pivot points | S3 | S2 | S1 | PP | R1 | R2 | R3 |
|---|---|---|---|---|---|---|---|
| Standard | -101.4 | 368.5 | 620.3 | 1,090.2 | 1,342.0 | 1,811.9 | 2,063.7 |
| Camarilla | 673.5 | 739.7 | 805.8 | 872.0 | 938.2 | 1,004.3 | 1,070.5 |
| Woodie | -210.6 | 314.0 | 511.2 | 1,035.7 | 1,232.9 | 1,757.4 | 1,954.6 |
| Fibonacci | 368.5 | 644.2 | 814.5 | 1,090.2 | 1,365.9 | 1,536.2 | 1,811.9 |
| Pivot points | S3 | S2 | S1 | PP | R1 | R2 | R3 |
|---|---|---|---|---|---|---|---|
| Standard | 1,261.3 | 1,350.7 | 1,520.3 | 1,609.7 | 1,779.3 | 1,868.7 | 2,038.3 |
| Camarilla | 1,618.6 | 1,642.3 | 1,666.1 | 1,689.8 | 1,713.5 | 1,737.3 | 1,761.0 |
| Woodie | 1,301.3 | 1,370.8 | 1,560.3 | 1,629.8 | 1,819.3 | 1,888.8 | 2,078.3 |
| Fibonacci | 1,350.7 | 1,449.7 | 1,510.8 | 1,609.7 | 1,708.7 | 1,769.8 | 1,868.7 |
Numerical data
The following is the status of the technical indicators and moving averages at the time of publication of this technical analysis:
| RSI (14): | 15.60 | |
| MACD (12,26,9): | -186.5000 | |
| Directional Movement: | -53.0 | |
| AROON (14): | -57.2 | |
| DEMA (21): | 1,070.7 | |
| Parabolic SAR (0,02-0,02-0,2): | 1,235.9 | |
| Elder Ray (13): | -358.7 | |
| Super Trend (3,10): | 1,063.4 | |
| Zig ZAG (10): | 817.1 | |
| VORTEX (21): | 0.6000 | |
| Stochastique (14,3,5): | 1.80 | |
| TEMA (21): | 908.6 | |
| Williams %R (14): | -95.30 | |
| Chande Momentum Oscillator (20): | -757.1 | |
| Repulse (5,40,3): | -14.0000 | |
| ROCnROLL: | 2 | |
| TRIX (15,9): | -0.8000 | |
| Courbe Coppock: | 73.40 |
| MA7: | 1,019.7 | |
| MA20: | 1,395.5 | |
| MA50: | 1,486.3 | |
| MA100: | 1,481.2 | |
| MAexp7: | 990.4 | |
| MAexp20: | 1,271.5 | |
| MAexp50: | 1,419.6 | |
| MAexp100: | 1,452.8 | |
| Price / MA7: | -19.87% | |
| Price / MA20: | -41.45% | |
| Price / MA50: | -45.02% | |
| Price / MA100: | -44.84% | |
| Price / MAexp7: | -17.50% | |
| Price / MAexp20: | -35.74% | |
| Price / MAexp50: | -42.44% | |
| Price / MAexp100: | -43.76% |
News
The last news published on ADYEN at the time of the generation of this analysis was as follows:
- DGAP-News: Adyen Expands Global Acquiring Capabilities to Malaysia
- Michael Hill Helps Customers Continue to Celebrate Life’s Special Moments
- Easi Partners With Adyen to Help Deliver Secure Payment Experiences
About author
Online


Add a comment
Comments
0 comments on the analysis ADYEN - Daily