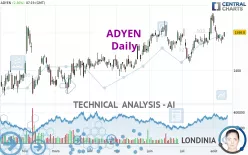
ADYEN - Daily - Technical analysis published on 08/10/2023 (GMT)
- 216
- 0
Click here for a new analysis!
- Timeframe : Daily
- - Analysis generated on
- Status : INVALID

Summary of the analysis

Additional analysis
Quotes
The ADYEN price is 1,598.8 EUR. On the day, this instrument gained +2.36% and was traded between 1,573.8 EUR and 1,599.0 EUR over the period. The price is currently at +1.59% from its lowest and -0.01% from its highest.A bullish opening was detected by the Central Gaps scanner. Buyers are trying to impose a bullish momentum in the very short term.
Bullish opening
Type : Bullish
Timeframe : Openning
Here is a more detailed summary of the historical variations registered by ADYEN:
Technical
A technical analysis in Daily of this ADYEN chart shows a strongly bullish trend. 92.86% of the signals given by moving averages are bullish. This strongly bullish trend is supported by the strong bullish signals given by short-term moving averages. An assessment of moving averages reveals several bullish signals that could impact this trend:
Bullish price crossover with Moving Average 20
Type : Bullish
Timeframe : Daily
Bullish price crossover with Moving Average 50
Type : Bullish
Timeframe : Daily
The probability of a further increase is slight given the direction of the technical indicators.
Other results related to technical indicators were also found by the Central Indicators scanner:
Pivot points : price is over resistance 2
Type : Neutral
Timeframe : Daily
RSI indicator is back over 50
Type : Bullish
Timeframe : Daily
Ichimoku : price is over the cloud
Type : Bullish
Timeframe : Daily
Momentum indicator is back over 0
Type : Bullish
Timeframe : Daily
An analysis of the price chart with the Central Patterns scanner (detector of chart patterns and resistances and supports) shows a result that can have an impact on the price change:
Near support of channel
Type : Bullish
Timeframe : Daily
The Central Candlesticks scanner which studies Japanese candlesticks did not detect anything.
| S3 | S2 | S1 | Price | R1 | R2 | R3 | |
|---|---|---|---|---|---|---|---|
| ProTrendLines | 1,396.1 | 1,446.6 | 1,544.2 | 1,598.8 | 1,624.5 | 1,689.8 | 1,862.0 |
| Change (%) | -12.68% | -9.52% | -3.42% | - | +1.61% | +5.69% | +16.46% |
| Change | -202.7 | -152.2 | -54.6 | - | +25.7 | +91.0 | +263.2 |
| Level | Minor | Major | Intermediate | - | Major | Major | Minor |
Attention could also be paid to pivot points to set price objectives:
| Pivot points | S3 | S2 | S1 | PP | R1 | R2 | R3 |
|---|---|---|---|---|---|---|---|
| Standard | 1,530.8 | 1,545.2 | 1,553.6 | 1,568.0 | 1,576.4 | 1,590.8 | 1,599.2 |
| Camarilla | 1,555.7 | 1,557.8 | 1,559.9 | 1,562.0 | 1,564.1 | 1,566.2 | 1,568.3 |
| Woodie | 1,527.8 | 1,543.7 | 1,550.6 | 1,566.5 | 1,573.4 | 1,589.3 | 1,596.2 |
| Fibonacci | 1,545.2 | 1,553.9 | 1,559.3 | 1,568.0 | 1,576.7 | 1,582.1 | 1,590.8 |
| Pivot points | S3 | S2 | S1 | PP | R1 | R2 | R3 |
|---|---|---|---|---|---|---|---|
| Standard | 1,374.6 | 1,462.8 | 1,522.8 | 1,611.0 | 1,671.0 | 1,759.2 | 1,819.2 |
| Camarilla | 1,542.1 | 1,555.6 | 1,569.2 | 1,582.8 | 1,596.4 | 1,610.0 | 1,623.6 |
| Woodie | 1,360.5 | 1,455.8 | 1,508.7 | 1,604.0 | 1,656.9 | 1,752.2 | 1,805.1 |
| Fibonacci | 1,462.8 | 1,519.4 | 1,554.4 | 1,611.0 | 1,667.6 | 1,702.6 | 1,759.2 |
| Pivot points | S3 | S2 | S1 | PP | R1 | R2 | R3 |
|---|---|---|---|---|---|---|---|
| Standard | 1,261.3 | 1,350.7 | 1,520.3 | 1,609.7 | 1,779.3 | 1,868.7 | 2,038.3 |
| Camarilla | 1,618.6 | 1,642.3 | 1,666.1 | 1,689.8 | 1,713.5 | 1,737.3 | 1,761.0 |
| Woodie | 1,301.3 | 1,370.8 | 1,560.3 | 1,629.8 | 1,819.3 | 1,888.8 | 2,078.3 |
| Fibonacci | 1,350.7 | 1,449.7 | 1,510.8 | 1,609.7 | 1,708.7 | 1,769.8 | 1,868.7 |
Numerical data
The following are the details of the technical indicators and moving averages that were collected to generate this technical analysis:
| RSI (14): | 53.80 | |
| MACD (12,26,9): | 9.5000 | |
| Directional Movement: | 1.3 | |
| AROON (14): | 42.9 | |
| DEMA (21): | 1,593.4 | |
| Parabolic SAR (0,02-0,02-0,2): | 1,681.4 | |
| Elder Ray (13): | 2.6 | |
| Super Trend (3,10): | 1,543.2 | |
| Zig ZAG (10): | 1,594.2 | |
| VORTEX (21): | 1.0000 | |
| Stochastique (14,3,5): | 26.50 | |
| TEMA (21): | 1,590.7 | |
| Williams %R (14): | -63.30 | |
| Chande Momentum Oscillator (20): | 45.2 | |
| Repulse (5,40,3): | 0.0000 | |
| ROCnROLL: | 1 | |
| TRIX (15,9): | 0.1000 | |
| Courbe Coppock: | 4.60 |
| MA7: | 1,577.1 | |
| MA20: | 1,582.2 | |
| MA50: | 1,567.5 | |
| MA100: | 1,506.8 | |
| MAexp7: | 1,582.4 | |
| MAexp20: | 1,579.3 | |
| MAexp50: | 1,555.0 | |
| MAexp100: | 1,518.8 | |
| Price / MA7: | +1.38% | |
| Price / MA20: | +1.05% | |
| Price / MA50: | +2.00% | |
| Price / MA100: | +6.11% | |
| Price / MAexp7: | +1.04% | |
| Price / MAexp20: | +1.23% | |
| Price / MAexp50: | +2.82% | |
| Price / MAexp100: | +5.27% |
News
The last news published on ADYEN at the time of the generation of this analysis was as follows:
- DGAP-News: Adyen Expands Global Acquiring Capabilities to Malaysia
- Michael Hill Helps Customers Continue to Celebrate Life’s Special Moments
- Easi Partners With Adyen to Help Deliver Secure Payment Experiences
About author
Online


Add a comment
Comments
0 comments on the analysis ADYEN - Daily