CARBON PROTOCOL - SWTH/USDT - Daily - Technical analysis published on 06/17/2019 (GMT)
- 312
- 0
- Who voted?
Click here for a new analysis!
- Timeframe : Daily
- - Analysis generated on
- Status : INVALID

Summary of the analysis

Additional analysis
Quotes
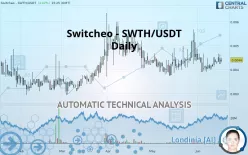
Switcheo - SWTH/USDT rating 0.004400 USDT. On the day, this instrument gained +4.02% and was between 0.004299 USDT and 0.004493 USDT. This implies that the price is at +2.35% from its lowest and at -2.07% from its highest.The Central Gaps scanner detects a bullish opening marking the presence of buyers ahead of sellers at the opening but not sufficiently marked to allow the price to register a quotation gap.
Bullish opening
Type : Bullish
Timeframe : Openning
So that you have an overall view of the price change, here is a table showing the variations over several periods:
Technical
A technical analysis in Daily of this Switcheo - SWTH/USDT chart shows a bullish trend. 64.29% of the signals given by moving averages are bullish. The overall trend seems to be showing some signs of weakness, as do the tentative bullish signals given by short-term moving averages. The Central Indicators scanner detects bearish signals on moving averages that could impact this trend:
Bearish price crossover with Moving Average 20
Type : Bearish
Timeframe : Daily
Bearish price crossover with Moving Average 50
Type : Bearish
Timeframe : Daily
Bearish price crossover with Moving Average 100
Type : Bearish
Timeframe : Daily
Bearish price crossover with adaptative moving average 20
Type : Bearish
Timeframe : Daily
Bearish price crossover with adaptative moving average 50
Type : Bearish
Timeframe : Daily
In fact, according to the parameters integrated into the Central Analyzer system, 11 technical indicators out of 18 analysed are currently bullish. But beware of excesses. The Central Indicators scanner currently detects this:
MACD indicator: bearish divergence
Type : Bearish
Timeframe : Daily
Williams %R indicator is overbought : over -20
Type : Neutral
Timeframe : Daily
RSI indicator is back under 50
Type : Bearish
Timeframe : Daily
Ichimoku : price is under the cloud
Type : Bearish
Timeframe : Daily
Price is back over the pivot point
Type : Bullish
Timeframe : Weekly
Price is back under the pivot point
Type : Bearish
Timeframe : Daily
Williams %R indicator is back under -50
Type : Bearish
Timeframe : Daily
The Central Patterns scanner, which studies chart patterns, resistances and supports, has identified these signals:
Near resistance of channel
Type : Bearish
Timeframe : Daily
Horizontal resistance is broken
Type : Bullish
Timeframe : Daily
The Central Candlesticks scanner, specialised in Japanese candlesticks, did not identify any signals.
| S3 | S2 | S1 | Price | R1 | R2 | R3 | |
|---|---|---|---|---|---|---|---|
| ProTrendLines | 0.003113 | 0.003755 | 0.004288 | 0.004400 | 0.005144 | 0.005785 | 0.007392 |
| Change (%) | -29.25% | -14.66% | -2.55% | - | +16.91% | +31.48% | +68.00% |
| Change | -0.001287 | -0.000645 | -0.000112 | - | +0.000744 | +0.001385 | +0.002992 |
| Level | Minor | Intermediate | Minor | - | Intermediate | Intermediate | Minor |
Attention could also be paid to pivot points to set price objectives:
| Pivot points | S3 | S2 | S1 | PP | R1 | R2 | R3 |
|---|---|---|---|---|---|---|---|
| Standard | 0.003665 | 0.003941 | 0.004086 | 0.004362 | 0.004507 | 0.004783 | 0.004928 |
| Camarilla | 0.004114 | 0.004153 | 0.004191 | 0.004230 | 0.004269 | 0.004307 | 0.004346 |
| Woodie | 0.003599 | 0.003908 | 0.004020 | 0.004329 | 0.004440 | 0.004750 | 0.004862 |
| Fibonacci | 0.003941 | 0.004102 | 0.004202 | 0.004362 | 0.004523 | 0.004623 | 0.004783 |
| Pivot points | S3 | S2 | S1 | PP | R1 | R2 | R3 |
|---|---|---|---|---|---|---|---|
| Standard | 0.003417 | 0.003698 | 0.004102 | 0.004383 | 0.004787 | 0.005068 | 0.005472 |
| Camarilla | 0.004317 | 0.004379 | 0.004442 | 0.004505 | 0.004568 | 0.004631 | 0.004693 |
| Woodie | 0.003478 | 0.003729 | 0.004163 | 0.004414 | 0.004848 | 0.005099 | 0.005532 |
| Fibonacci | 0.003698 | 0.003960 | 0.004122 | 0.004383 | 0.004645 | 0.004807 | 0.005068 |
Numerical data
The following is the status of the technical indicators and moving averages at the time of publication of this technical analysis:
| RSI (14): | 51.76 | |
| MACD (12,26,9): | -0.0000 | |
| Directional Movement: | 13.818866 | |
| AROON (14): | -14.285714 | |
| DEMA (21): | 0.004305 | |
| Parabolic SAR (0,02-0,02-0,2): | 0.004692 | |
| Elder Ray (13): | 0.000079 | |
| Super Trend (3,10): | 0.003585 | |
| Zig ZAG (10): | 0.004400 | |
| VORTEX (21): | 0.9723 | |
| Stochastique (14,3,5): | 62.28 | |
| TEMA (21): | 0.004320 | |
| Williams %R (14): | -34.90 | |
| Chande Momentum Oscillator (20): | 0.000356 | |
| Repulse (5,40,3): | -2.9959 | |
| ROCnROLL: | 1 | |
| TRIX (15,9): | -0.0744 | |
| Courbe Coppock: | 3.09 |
| MA7: | 0.004357 | |
| MA20: | 0.004328 | |
| MA50: | 0.004284 | |
| MA100: | 0.004366 | |
| MAexp7: | 0.004336 | |
| MAexp20: | 0.004318 | |
| MAexp50: | 0.004337 | |
| MAexp100: | 0.004370 | |
| Price / MA7: | +0.99% | |
| Price / MA20: | +1.66% | |
| Price / MA50: | +2.71% | |
| Price / MA100: | +0.78% | |
| Price / MAexp7: | +1.48% | |
| Price / MAexp20: | +1.90% | |
| Price / MAexp50: | +1.45% | |
| Price / MAexp100: | +0.69% |
About author

Online


Add a comment
Comments
0 comments on the analysis CARBON PROTOCOL - SWTH/USDT - Daily