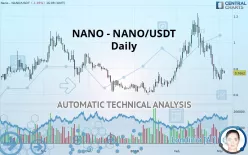
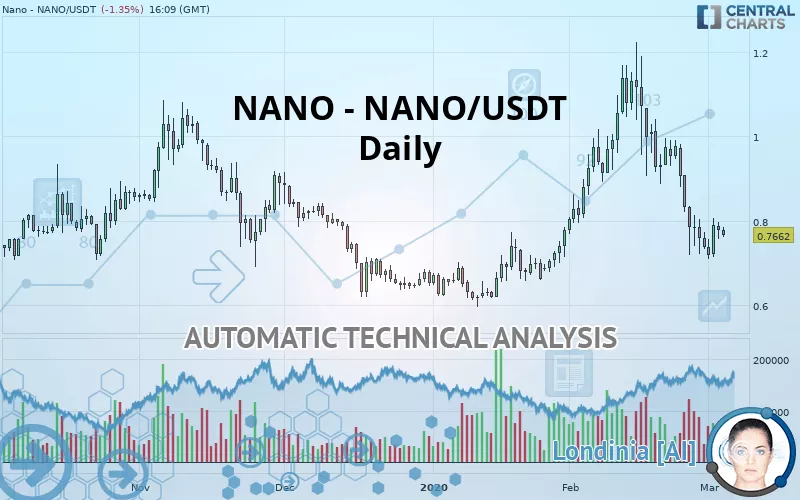
NANO - XNO/USDT - Daily - Technical analysis published on 03/04/2020 (GMT)
- 230
- 0
- Who voted?
Click here for a new analysis!
- Timeframe : Daily
- - Analysis generated on
- Status : INVALID
Summary of the analysis

Additional analysis
Quotes
The NANO - NANO/USDT rating is 0.766200 USDT. The price registered a decrease of -1.35% on the session and was between 0.761700 USDT and 0.785900 USDT. This implies that the price is at +0.59% from its lowest and at -2.51% from its highest.The Central Gaps scanner detects a bullish opening. A small advantage for buyers in the very short term.
Bullish opening
Type : Bullish
Timeframe : Openning
So that you have an overall view of the price change, here is a table showing the variations over several periods:
Technical
Technical analysis of NANO - NANO/USDT in Daily shows an overall bearish trend. The signals given by moving averages are 64.29% bearish. This bearish trend is reinforced by the strong signals currently being given by short-term moving averages. The Central Indicators market scanner is currently detecting a bearish signal that could impact this trend:
Bearish price crossover with Moving Average 100
Type : Bearish
Timeframe : Daily
An assessment of technical indicators does not currently provide any relevant information to suggest whether the signal given by the technical indicators is more bullish or bearish.
Other results related to technical indicators were also found by the Central Indicators scanner:
Ichimoku : price is under the cloud
Type : Bearish
Timeframe : Daily
Price is back under the pivot point
Type : Bearish
Timeframe : Weekly
The Central Patterns scanner, which studies chart patterns, resistances and supports, has identified these signals:
Near horizontal support
Type : Bullish
Timeframe : Daily
Support of channel is broken
Type : Bearish
Timeframe : Daily
The presence of a bearish pattern in Japanese candlesticks detected by Central Candlesticks that could cause a correction in the very short term was also detected:
Bearish harami
Type : Bearish
Timeframe : Daily
| S3 | S2 | S1 | Price | R1 | R2 | R3 | |
|---|---|---|---|---|---|---|---|
| ProTrendLines | 0.618980 | 0.660700 | 0.717500 | 0.766200 | 0.811850 | 0.956420 | 1.044000 |
| Change (%) | -19.21% | -13.77% | -6.36% | - | +5.96% | +24.83% | +36.26% |
| Change | -0.147220 | -0.105500 | -0.048700 | - | +0.045650 | +0.190220 | +0.277800 |
| Level | Minor | Minor | Major | - | Major | Minor | Intermediate |
Pivot points can also be used to set your price objectives. Here is the price situation in relation to pivot points:
| Pivot points | S3 | S2 | S1 | PP | R1 | R2 | R3 |
|---|---|---|---|---|---|---|---|
| Standard | 0.716800 | 0.736700 | 0.756700 | 0.776600 | 0.796600 | 0.816500 | 0.836500 |
| Camarilla | 0.765728 | 0.769385 | 0.773043 | 0.776700 | 0.780358 | 0.784015 | 0.787673 |
| Woodie | 0.716850 | 0.736725 | 0.756750 | 0.776625 | 0.796650 | 0.816525 | 0.836550 |
| Fibonacci | 0.736700 | 0.751942 | 0.761358 | 0.776600 | 0.791842 | 0.801258 | 0.816500 |
| Pivot points | S3 | S2 | S1 | PP | R1 | R2 | R3 |
|---|---|---|---|---|---|---|---|
| Standard | 0.370233 | 0.544967 | 0.641333 | 0.816067 | 0.912433 | 1.087167 | 1.183533 |
| Camarilla | 0.663148 | 0.687998 | 0.712849 | 0.737700 | 0.762551 | 0.787402 | 0.812253 |
| Woodie | 0.331050 | 0.525375 | 0.602150 | 0.796475 | 0.873250 | 1.067575 | 1.144350 |
| Fibonacci | 0.544967 | 0.648527 | 0.712507 | 0.816067 | 0.919627 | 0.983606 | 1.087167 |
| Pivot points | S3 | S2 | S1 | PP | R1 | R2 | R3 |
|---|---|---|---|---|---|---|---|
| Standard | 0.060633 | 0.390167 | 0.563933 | 0.893467 | 1.067233 | 1.396767 | 1.570533 |
| Camarilla | 0.599293 | 0.645428 | 0.691564 | 0.737700 | 0.783836 | 0.829972 | 0.876108 |
| Woodie | -0.017250 | 0.351225 | 0.486050 | 0.854525 | 0.989350 | 1.357825 | 1.492650 |
| Fibonacci | 0.390167 | 0.582427 | 0.701206 | 0.893467 | 1.085727 | 1.204506 | 1.396767 |
Numerical data
The following are the details of the technical indicators and moving averages that were collected to generate this technical analysis:
| RSI (14): | 40.94 | |
| MACD (12,26,9): | -0.0394 | |
| Directional Movement: | -6.720486 | |
| AROON (14): | -78.571426 | |
| DEMA (21): | 0.810274 | |
| Parabolic SAR (0,02-0,02-0,2): | 0.850621 | |
| Elder Ray (13): | -0.043712 | |
| Super Trend (3,10): | 0.981939 | |
| Zig ZAG (10): | 0.772100 | |
| VORTEX (21): | 0.8503 | |
| Stochastique (14,3,5): | 22.23 | |
| TEMA (21): | 0.744120 | |
| Williams %R (14): | -77.79 | |
| Chande Momentum Oscillator (20): | -0.200800 | |
| Repulse (5,40,3): | 0.0369 | |
| ROCnROLL: | 2 | |
| TRIX (15,9): | -0.2258 | |
| Courbe Coppock: | 47.11 |
| MA7: | 0.762757 | |
| MA20: | 0.897910 | |
| MA50: | 0.841924 | |
| MA100: | 0.786090 | |
| MAexp7: | 0.782733 | |
| MAexp20: | 0.846048 | |
| MAexp50: | 0.844473 | |
| MAexp100: | 0.833444 | |
| Price / MA7: | +0.45% | |
| Price / MA20: | -14.67% | |
| Price / MA50: | -8.99% | |
| Price / MA100: | -2.53% | |
| Price / MAexp7: | -2.11% | |
| Price / MAexp20: | -9.44% | |
| Price / MAexp50: | -9.27% | |
| Price / MAexp100: | -8.07% |
About author

Online


Add a comment
Comments
0 comments on the analysis NANO - XNO/USDT - Daily