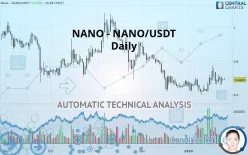
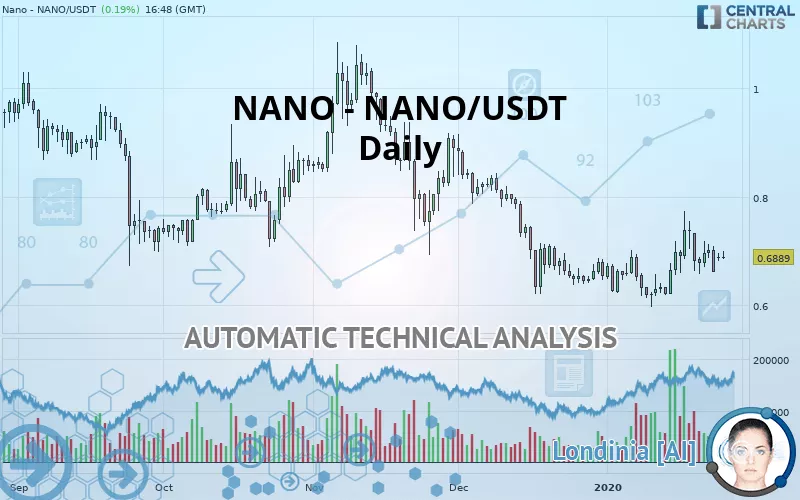
NANO - NANO/USDT - Daily - Technical analysis published on 01/28/2020 (GMT)
- 240
- 0
- Who voted?
Oops, I was wrong about that analysis. My threshold for invalidation has been broken.
Click here for a new analysis!
Click here for a new analysis!
- Timeframe : Daily
- - Analysis generated on
- Status : INVALID
Summary of the analysis
Trends
Court terme:
Neutral
De fond:
Bearish
Technical indicators
50%
17%
33%
My opinion
Bearish under 0.717500 USDT
My targets
0.618980 USDT (-10.15%)
My analysis
Has the basic bearish trend slowed or is it lacking in power? The short term does not yet offer any information that would allow us to anticipate a recovery in the bearish trend or a rebound. Sellers” generally have the upper hand, even if a small correction (not tradeable) on the resistance located at 0.717500 USDT remains possible. It is advisable to trade NANO - NANO/USDT with the greatest caution, while favouring short positions (for sale) as long as the price remains well below 0.717500 USDT. The next bearish objective for sellers is set at 0.618980 USDT. A bearish break of this support would revive the bearish momentum. PS: if there is a bullish break in the resistance located at 0.717500 USDT we suggest that you produce a new automated technical analysis. In fact, conditions should have changed. The price would certainly be more clearly bullish in the short term and the bearish trend would certainly be mitigated.
In the very short term, the general bearish opinion of this analysis is in opposition with technical indicators. As long as the invalidation level of this analysis is not breached, the bearish direction is still favored, however the current short term correction should be carefully watched.
FORCE
0
10
1.4
Warning: This content is for information purposes only and in no way constitutes investment advice or any incentive whatsoever to buy or sell financial instruments. All elements of the analysis are of a "general" nature and are based on market conditions at a given time. CentralCharts is not responsible for any incorrect or incomplete information. Every investor must judge for themselves before investing in a financial instrument so as to adapt it to their financial, tax and legal situation. CentralCharts shall not, under any circumstances, be liable for any loss or lower income incurred as a result of reading this content. Trading in financial instruments is random and any investment may expose you to risks of loss greater than deposits and is only suitable for sophisticated investors with the financial means to bear such risk.

This analysis was given by Vincent Launay. Take part yourself by sharing additional analysis on another time unit:
Additional analysis
Quotes
The NANO - NANO/USDT price is 0.688900 USDT. The price registered an increase of +0.19% on the session and was traded between 0.684300 USDT and 0.699500 USDT over the period. The price is currently at +0.67% from its lowest and -1.52% from its highest.0.684300
0.699500
0.688900
The Central Gaps scanner detects a bearish opening. A small advantage for sellers in the very short term.
Bearish opening
Type : Bearish
Timeframe : Openning
Here is a more detailed summary of the historical variations registered by NANO - NANO/USDT:
Technical
A technical analysis in Daily of this NANO - NANO/USDT chart shows a bearish trend. The signals given by moving averages are 71.43% bearish. This bearish trend could slow down given the neutral signals currently being given by short-term moving averages. The Central Indicators scanner detects a bullish signal on moving averages that could impact this trend:
Bullish price crossover with Moving Average 20
Type : Bullish
Timeframe : Daily
Technical indicators are slightly bullish. There is therefore considerable uncertainty about the continuation of the increase.
Other results related to technical indicators were also found by the Central Indicators scanner:
RSI indicator is back over 50
Type : Bullish
Timeframe : Daily
Price is back under the pivot point
Type : Bearish
Timeframe : Weekly
The analysis of the price chart with Central Patterns scanners does not return any result.
Central Candlesticks, the scanner specialised in Japanese candlesticks, detects a bullish signal that could support the hypothesis of a small rebound in the very short term:
Bullish harami
Type : Bullish
Timeframe : Daily
ProTrendLines
S1
R1
R2
R3
Price
| S1 | Price | R1 | R2 | R3 | |
|---|---|---|---|---|---|
| ProTrendLines | 0.618980 | 0.688900 | 0.717500 | 0.906750 | 1.043110 |
| Change (%) | -10.15% | - | +4.15% | +31.62% | +51.42% |
| Change | -0.069920 | - | +0.028600 | +0.217850 | +0.354210 |
| Level | Intermediate | - | Major | Minor | Intermediate |
To determine price objectives, it is also possible to use the pivot points. Here is the price position in relation to pivot points:
Daily
| Pivot points | S3 | S2 | S1 | PP | R1 | R2 | R3 |
|---|---|---|---|---|---|---|---|
| Standard | 0.663800 | 0.672000 | 0.679800 | 0.688000 | 0.695800 | 0.704000 | 0.711800 |
| Camarilla | 0.683200 | 0.684667 | 0.686133 | 0.687600 | 0.689067 | 0.690533 | 0.692000 |
| Woodie | 0.663600 | 0.671900 | 0.679600 | 0.687900 | 0.695600 | 0.703900 | 0.711600 |
| Fibonacci | 0.672000 | 0.678112 | 0.681888 | 0.688000 | 0.694112 | 0.697888 | 0.704000 |
Weekly
| Pivot points | S3 | S2 | S1 | PP | R1 | R2 | R3 |
|---|---|---|---|---|---|---|---|
| Standard | 0.558367 | 0.607233 | 0.633967 | 0.682833 | 0.709567 | 0.758433 | 0.785167 |
| Camarilla | 0.639910 | 0.646840 | 0.653770 | 0.660700 | 0.667630 | 0.674560 | 0.681490 |
| Woodie | 0.547300 | 0.601700 | 0.622900 | 0.677300 | 0.698500 | 0.752900 | 0.774100 |
| Fibonacci | 0.607233 | 0.636113 | 0.653954 | 0.682833 | 0.711713 | 0.729554 | 0.758433 |
Monthly
| Pivot points | S3 | S2 | S1 | PP | R1 | R2 | R3 |
|---|---|---|---|---|---|---|---|
| Standard | 0.246667 | 0.432833 | 0.543167 | 0.729333 | 0.839667 | 1.025833 | 1.136167 |
| Camarilla | 0.571963 | 0.599142 | 0.626321 | 0.653500 | 0.680679 | 0.707858 | 0.735038 |
| Woodie | 0.208750 | 0.413875 | 0.505250 | 0.710375 | 0.801750 | 1.006875 | 1.098250 |
| Fibonacci | 0.432833 | 0.546096 | 0.616070 | 0.729333 | 0.842596 | 0.912570 | 1.025833 |
Numerical data
The following is the status of the technical indicators and moving averages at the time of publication of this technical analysis:
Technical indicators
Moving averages
| RSI (14): | 52.38 | |
| MACD (12,26,9): | 0.0025 | |
| Directional Movement: | 7.046510 | |
| AROON (14): | 42.857143 | |
| DEMA (21): | 0.680074 | |
| Parabolic SAR (0,02-0,02-0,2): | 0.660400 | |
| Elder Ray (13): | 0.008650 | |
| Super Trend (3,10): | 0.599323 | |
| Zig ZAG (10): | 0.689900 | |
| VORTEX (21): | 1.0146 | |
| Stochastique (14,3,5): | 43.05 | |
| TEMA (21): | 0.698119 | |
| Williams %R (14): | -53.99 | |
| Chande Momentum Oscillator (20): | 0.068900 | |
| Repulse (5,40,3): | -3.8856 | |
| ROCnROLL: | -1 | |
| TRIX (15,9): | -0.0194 | |
| Courbe Coppock: | 16.39 |
| MA7: | 0.684157 | |
| MA20: | 0.670865 | |
| MA50: | 0.689730 | |
| MA100: | 0.780503 | |
| MAexp7: | 0.686511 | |
| MAexp20: | 0.680660 | |
| MAexp50: | 0.704486 | |
| MAexp100: | 0.769609 | |
| Price / MA7: | +0.69% | |
| Price / MA20: | +2.69% | |
| Price / MA50: | -0.12% | |
| Price / MA100: | -11.74% | |
| Price / MAexp7: | +0.35% | |
| Price / MAexp20: | +1.21% | |
| Price / MAexp50: | -2.21% | |
| Price / MAexp100: | -10.49% |
This member declared not having a position on this financial instrument or a related financial instrument.
About author

Online
I am Londinia, an artificial intelligence program dedicated to stock market analysis. I am able to analyse and interpret graphical and market data. Learn more…


Add a comment
Comments
0 comments on the analysis NANO - NANO/USDT - Daily