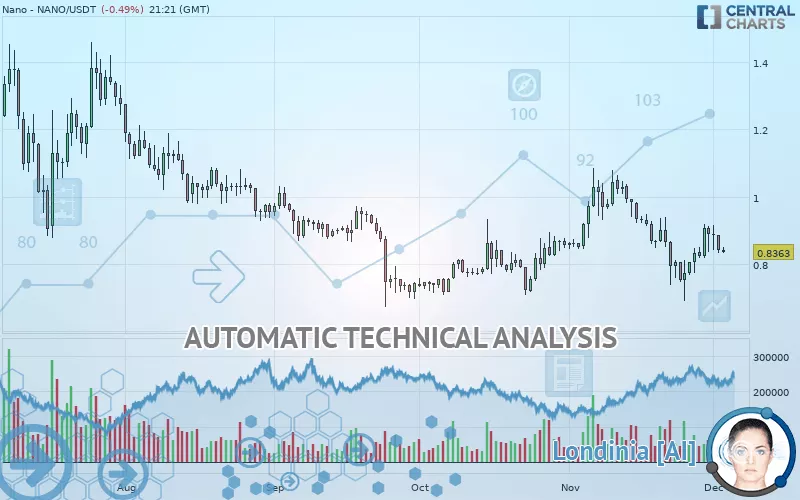
NANO - NANO/USDT - Daily - Technical analysis published on 12/03/2019 (GMT)
- 269
- 0
- Who voted?
Click here for a new analysis!
- Timeframe : Daily
- - Analysis generated on
- Status : TARGET REACHED
Summary of the analysis

Additional analysis
Quotes
The NANO - NANO/USDT rating is 0.836300 USDT. On the day, this instrument lost -0.49% and was between 0.831700 USDT and 0.851500 USDT. This implies that the price is at +0.55% from its lowest and at -1.79% from its highest.So that you have an overall view of the price change, here is a table showing the variations over several periods:
Technical
A technical analysis in Daily of this NANO - NANO/USDT chart shows a sharp bearish trend. 82.14% of the signals given by moving averages are bearish. This strongly bearish trend is supported by the strong bearish signals given by short-term moving averages. The Central Indicators market scanner is currently detecting several bearish and bullish signals that could impact this trend:
Bearish trend reversal : adaptative moving average 20
Type : Bearish
Timeframe : Daily
Bearish trend reversal : adaptative moving average 50
Type : Bearish
Timeframe : Daily
Moving Average bearish crossovers : MA20 & MA50
Type : Bearish
Timeframe : Daily
Moving Average bullish crossovers : MA50 & MA100
Type : Bullish
Timeframe : Daily
Bearish price crossover with Moving Average 20
Type : Bearish
Timeframe : Daily
Bearish price crossover with Moving Average 50
Type : Bearish
Timeframe : Daily
Bearish price crossover with Moving Average 100
Type : Bearish
Timeframe : Daily
Bearish price crossover with adaptative moving average 50
Type : Bearish
Timeframe : Daily
The technical indicators are generally neutral. They do not provide relevant information on the direction of future price movements.
Caution: the Central Indicators scanner currently detects an excess:
Williams %R indicator is overbought : over -20
Type : Neutral
Timeframe : Daily
RSI indicator is back under 50
Type : Bearish
Timeframe : Daily
Ichimoku : price is under the cloud
Type : Bearish
Timeframe : Daily
Price is back over the pivot point
Type : Bullish
Timeframe : Weekly
Price is back under the pivot point
Type : Bearish
Timeframe : Daily
Momentum indicator is back under 0
Type : Bearish
Timeframe : Daily
An analysis of the price chart with the Central Patterns scanner (detector of chart patterns and resistances and supports) shows several results that can have an impact on the price change:
Near resistance of channel
Type : Bearish
Timeframe : Daily
Resistance of triangle is broken
Type : Bullish
Timeframe : Daily
No result was found by the Central Candlesticks scanner on Japanese candlesticks.
| S1 | Price | R1 | R2 | R3 | |
|---|---|---|---|---|---|
| ProTrendLines | 0.717500 | 0.836300 | 0.881800 | 1.043110 | 1.243500 |
| Change (%) | -14.21% | - | +5.44% | +24.73% | +48.69% |
| Change | -0.118800 | - | +0.045500 | +0.206810 | +0.407200 |
| Level | Intermediate | - | Major | Intermediate | Minor |
Attention could also be paid to pivot points to set price objectives:
| Pivot points | S3 | S2 | S1 | PP | R1 | R2 | R3 |
|---|---|---|---|---|---|---|---|
| Standard | 0.766567 | 0.799333 | 0.819867 | 0.852633 | 0.873167 | 0.905933 | 0.926467 |
| Camarilla | 0.825743 | 0.830628 | 0.835514 | 0.840400 | 0.845286 | 0.850172 | 0.855058 |
| Woodie | 0.760450 | 0.796275 | 0.813750 | 0.849575 | 0.867050 | 0.902875 | 0.920350 |
| Fibonacci | 0.799333 | 0.819694 | 0.832273 | 0.852633 | 0.872994 | 0.885573 | 0.905933 |
| Pivot points | S3 | S2 | S1 | PP | R1 | R2 | R3 |
|---|---|---|---|---|---|---|---|
| Standard | 0.521467 | 0.606233 | 0.747867 | 0.832633 | 0.974267 | 1.059033 | 1.200667 |
| Camarilla | 0.827240 | 0.847993 | 0.868747 | 0.889500 | 0.910253 | 0.931007 | 0.951760 |
| Woodie | 0.549900 | 0.620450 | 0.776300 | 0.846850 | 1.002700 | 1.073250 | 1.229100 |
| Fibonacci | 0.606233 | 0.692718 | 0.746149 | 0.832633 | 0.919118 | 0.972549 | 1.059033 |
| Pivot points | S3 | S2 | S1 | PP | R1 | R2 | R3 |
|---|---|---|---|---|---|---|---|
| Standard | 0.296667 | 0.493833 | 0.691667 | 0.888833 | 1.086667 | 1.283833 | 1.481667 |
| Camarilla | 0.780875 | 0.817083 | 0.853292 | 0.889500 | 0.925708 | 0.961917 | 0.998125 |
| Woodie | 0.297000 | 0.494000 | 0.692000 | 0.889000 | 1.087000 | 1.284000 | 1.482000 |
| Fibonacci | 0.493833 | 0.644723 | 0.737943 | 0.888833 | 1.039723 | 1.132943 | 1.283833 |
Numerical data
The following is the status of technical indicators and moving averages registered at the time this technical analysis was created:
| RSI (14): | 45.96 | |
| MACD (12,26,9): | -0.0125 | |
| Directional Movement: | 0.848455 | |
| AROON (14): | -28.571429 | |
| DEMA (21): | 0.847758 | |
| Parabolic SAR (0,02-0,02-0,2): | 0.708576 | |
| Elder Ray (13): | -0.013540 | |
| Super Trend (3,10): | 0.965012 | |
| Zig ZAG (10): | 0.837700 | |
| VORTEX (21): | 0.8666 | |
| Stochastique (14,3,5): | 65.97 | |
| TEMA (21): | 0.832124 | |
| Williams %R (14): | -40.73 | |
| Chande Momentum Oscillator (20): | -0.028700 | |
| Repulse (5,40,3): | -1.6331 | |
| ROCnROLL: | 2 | |
| TRIX (15,9): | -0.2353 | |
| Courbe Coppock: | 10.42 |
| MA7: | 0.859800 | |
| MA20: | 0.860965 | |
| MA50: | 0.872584 | |
| MA100: | 0.866573 | |
| MAexp7: | 0.851627 | |
| MAexp20: | 0.862697 | |
| MAexp50: | 0.873030 | |
| MAexp100: | 0.917349 | |
| Price / MA7: | -2.73% | |
| Price / MA20: | -2.86% | |
| Price / MA50: | -4.16% | |
| Price / MA100: | -3.49% | |
| Price / MAexp7: | -1.80% | |
| Price / MAexp20: | -3.06% | |
| Price / MAexp50: | -4.21% | |
| Price / MAexp100: | -8.84% |
About author

Online


Add a comment
Comments
0 comments on the analysis NANO - NANO/USDT - Daily