SOYBEAN - 1H - Technical analysis published on 09/26/2024 (GMT)
- 145
- 0
Click here for a new analysis!
- Timeframe : 1H
- - Analysis generated on
- Status : INVALID

Summary of the analysis
Additional analysis
Quotes
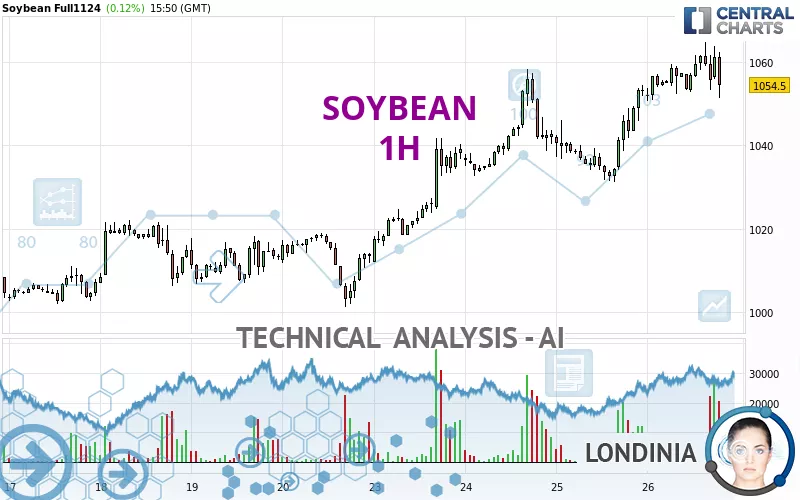
The SOYBEAN rating is 1,054.50 USD. The price registered an increase of +0.12% on the session and was traded between 1,050.50 USD and 1,064.75 USD over the period. The price is currently at +0.38% from its lowest and -0.96% from its highest.The Central Gaps scanner detects a bearish opening marking the presence of sellers ahead of buyers at the opening but not sufficiently marked to allow the price to register a quotation gap.
Bearish opening
Type : Bearish
Timeframe : Openning
Here is a more detailed summary of the historical variations registered by SOYBEAN:
New HIGH record (1 month)
Type : Bullish
Timeframe : Weekly
Technical
Technical analysis of this 1H chart of SOYBEAN indicates that the overall trend is strongly bullish. 82.14% of the signals given by moving averages are bullish. The slightly bullish signals given by the short-term moving averages indicate this trend is showing signs of running out of steam. An assessment of moving averages reveals several bearish signals that could impact this trend:
Bearish price crossover with Moving Average 20
Type : Bearish
Timeframe : 1 hour
Bearish price crossover with adaptative moving average 20
Type : Bearish
Timeframe : 1 hour
An assessment of technical indicators does not currently provide any relevant information on the direction of future price movements.
Caution: the Central Indicators scanner currently detects an excess:
CCI indicator: bearish divergence
Type : Bearish
Timeframe : 1 hour
Pivot points : price is over resistance 3
Type : Neutral
Timeframe : Weekly
Momentum indicator is back under 0
Type : Bearish
Timeframe : 1 hour
Williams %R indicator is back under -50
Type : Bearish
Timeframe : 1 hour
Central Patterns, the scanner specializing in chart patterns, did not identify any signals.
The Central Candlesticks scanner, specialised in Japanese candlesticks, did not identify any signals.
| S3 | S2 | S1 | Price | R1 | R2 | R3 | |
|---|---|---|---|---|---|---|---|
| ProTrendLines | 1,021.00 | 1,032.50 | 1,041.75 | 1,054.50 | 1,058.25 | 1,096.00 | 1,186.85 |
| Change (%) | -3.18% | -2.09% | -1.21% | - | +0.36% | +3.94% | +12.55% |
| Change | -33.50 | -22.00 | -12.75 | - | +3.75 | +41.50 | +132.35 |
| Level | Major | Major | Minor | - | Intermediate | Major | Major |
To determine price objectives, it is also possible to use the pivot points. Here is the price position in relation to pivot points:
| Pivot points | S3 | S2 | S1 | PP | R1 | R2 | R3 |
|---|---|---|---|---|---|---|---|
| Standard | 1,014.92 | 1,023.08 | 1,038.17 | 1,046.33 | 1,061.42 | 1,069.58 | 1,084.67 |
| Camarilla | 1,046.86 | 1,048.99 | 1,051.12 | 1,053.25 | 1,055.38 | 1,057.51 | 1,059.64 |
| Woodie | 1,018.38 | 1,024.81 | 1,041.63 | 1,048.06 | 1,064.88 | 1,071.31 | 1,088.13 |
| Fibonacci | 1,023.08 | 1,031.97 | 1,037.45 | 1,046.33 | 1,055.22 | 1,060.70 | 1,069.58 |
| Pivot points | S3 | S2 | S1 | PP | R1 | R2 | R3 |
|---|---|---|---|---|---|---|---|
| Standard | 977.00 | 988.00 | 1,000.00 | 1,011.00 | 1,023.00 | 1,034.00 | 1,046.00 |
| Camarilla | 1,005.68 | 1,007.78 | 1,009.89 | 1,012.00 | 1,014.11 | 1,016.22 | 1,018.33 |
| Woodie | 977.50 | 988.25 | 1,000.50 | 1,011.25 | 1,023.50 | 1,034.25 | 1,046.50 |
| Fibonacci | 988.00 | 996.79 | 1,002.21 | 1,011.00 | 1,019.79 | 1,025.21 | 1,034.00 |
| Pivot points | S3 | S2 | S1 | PP | R1 | R2 | R3 |
|---|---|---|---|---|---|---|---|
| Standard | 869.00 | 912.00 | 956.00 | 999.00 | 1,043.00 | 1,086.00 | 1,130.00 |
| Camarilla | 976.08 | 984.05 | 992.03 | 1,000.00 | 1,007.98 | 1,015.95 | 1,023.93 |
| Woodie | 869.50 | 912.25 | 956.50 | 999.25 | 1,043.50 | 1,086.25 | 1,130.50 |
| Fibonacci | 912.00 | 945.23 | 965.77 | 999.00 | 1,032.23 | 1,052.77 | 1,086.00 |
Numerical data
The following is the status of technical indicators and moving averages registered at the time this technical analysis was created:
| RSI (14): | 51.38 | |
| MACD (12,26,9): | 3.9400 | |
| Directional Movement: | 2.35 | |
| AROON (14): | 78.57 | |
| DEMA (21): | 1,059.60 | |
| Parabolic SAR (0,02-0,02-0,2): | 1,064.52 | |
| Elder Ray (13): | 0.60 | |
| Super Trend (3,10): | 1,048.75 | |
| Zig ZAG (10): | 1,053.25 | |
| VORTEX (21): | 1.1500 | |
| Stochastique (14,3,5): | 44.07 | |
| TEMA (21): | 1,060.25 | |
| Williams %R (14): | -75.93 | |
| Chande Momentum Oscillator (20): | -0.75 | |
| Repulse (5,40,3): | -0.6400 | |
| ROCnROLL: | -1 | |
| TRIX (15,9): | 0.0600 | |
| Courbe Coppock: | 1.15 |
| MA7: | 1,032.61 | |
| MA20: | 1,016.58 | |
| MA50: | 1,011.50 | |
| MA100: | 1,065.98 | |
| MAexp7: | 1,057.42 | |
| MAexp20: | 1,054.13 | |
| MAexp50: | 1,046.37 | |
| MAexp100: | 1,037.02 | |
| Price / MA7: | +2.12% | |
| Price / MA20: | +3.73% | |
| Price / MA50: | +4.25% | |
| Price / MA100: | -1.08% | |
| Price / MAexp7: | -0.28% | |
| Price / MAexp20: | +0.04% | |
| Price / MAexp50: | +0.78% | |
| Price / MAexp100: | +1.69% |
News
Don't forget to follow the news on SOYBEAN. At the time of publication of this analysis, the latest news was as follows:
-
 Ahead Of Trump-Xi Meeting, USDA Announces Huge Soybean Sale To China
-
Soybean farmer: We would like to have markets, not aid
-
Impact of tariffs on America's soybean farmers
-
Will Trump's Truce With China Help Soybean Sales?
-
U.S. Trade Gap Hits 10-Year High In October As Soybean Exports Continue To Fall
About author

Online


Add a comment
Comments
0 comments on the analysis SOYBEAN - 1H