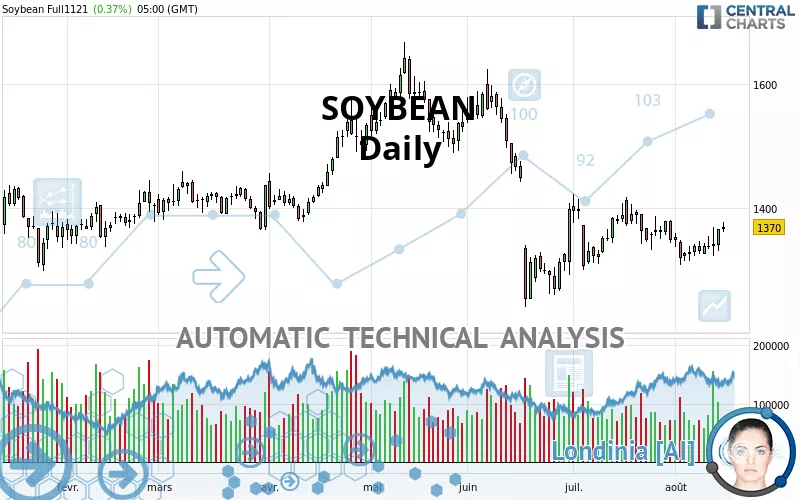
SOYBEAN - Daily - Technical analysis published on 08/16/2021 (GMT)
- 267
- 0
Click here for a new analysis!
- Timeframe : Daily
- - Analysis generated on
- Status : TARGET REACHED
Summary of the analysis

Additional analysis
Quotes
The SOYBEAN rating is 1,370.00 USD. On the day, this instrument gained +0.37% with the lowest point at 1,360.75 USD and the highest point at 1,378.00 USD. The deviation from the price is +0.68% for the low point and -0.58% for the high point.A bullish gap was detected at the opening by the Central Gaps scanner. There are a lot of buyers and they have the upper hand in the very short term.
Opening Gap UP
Type : Bullish
Timeframe : Openning
A study of price movements over other periods shows the following variations:
Technical
Technical analysis of SOYBEAN in Daily shows an overall bearish trend. 75.00% of the signals given by moving averages are bearish. Caution: as the signals currently given by short-term moving averages are rather neutral, the bearish trend could slow down. The Central Indicators scanner detects bullish signals on moving averages that could impact this trend:
Bullish trend reversal : adaptative moving average 20
Type : Bullish
Timeframe : Daily
Bullish price crossover with Moving Average 20
Type : Bullish
Timeframe : Daily
An assessment of technical indicators shows a moderate bullish signal.
Central Indicators, the detector scanner for these technical indicators has recently detected several signals:
RSI indicator is back over 50
Type : Bullish
Timeframe : Daily
Price is back over the pivot point
Type : Bullish
Timeframe : Daily
Price is back over the pivot point
Type : Bullish
Timeframe : Weekly
Momentum indicator is back over 0
Type : Bullish
Timeframe : Daily
Williams %R indicator is back over -50
Type : Bullish
Timeframe : Daily
No signals are given by Central Patterns, a market scanner specialised in chart patterns, resistances and supports.
The Central Candlesticks scanner, specialised in Japanese candlesticks, did not identify any signals.
| S3 | S2 | S1 | Price | R1 | R2 | R3 | |
|---|---|---|---|---|---|---|---|
| ProTrendLines | 1,268.00 | 1,320.00 | 1,366.75 | 1,370.00 | 1,440.00 | 1,518.75 | 1,583.75 |
| Change (%) | -7.45% | -3.65% | -0.24% | - | +5.11% | +10.86% | +15.60% |
| Change | -102.00 | -50.00 | -3.25 | - | +70.00 | +148.75 | +213.75 |
| Level | Major | Minor | Intermediate | - | Intermediate | Intermediate | Minor |
Attention could also be paid to pivot points to set price objectives:
| Pivot points | S3 | S2 | S1 | PP | R1 | R2 | R3 |
|---|---|---|---|---|---|---|---|
| Standard | 1,305.83 | 1,317.92 | 1,341.83 | 1,353.92 | 1,377.83 | 1,389.92 | 1,413.83 |
| Camarilla | 1,355.85 | 1,359.15 | 1,362.45 | 1,365.75 | 1,369.05 | 1,372.35 | 1,375.65 |
| Woodie | 1,311.75 | 1,320.88 | 1,347.75 | 1,356.88 | 1,383.75 | 1,392.88 | 1,419.75 |
| Fibonacci | 1,317.92 | 1,331.67 | 1,340.17 | 1,353.92 | 1,367.67 | 1,376.17 | 1,389.92 |
| Pivot points | S3 | S2 | S1 | PP | R1 | R2 | R3 |
|---|---|---|---|---|---|---|---|
| Standard | 1,289.50 | 1,306.25 | 1,336.00 | 1,352.75 | 1,382.50 | 1,399.25 | 1,429.00 |
| Camarilla | 1,352.96 | 1,357.23 | 1,361.49 | 1,365.75 | 1,370.01 | 1,374.28 | 1,378.54 |
| Woodie | 1,296.00 | 1,309.50 | 1,342.50 | 1,356.00 | 1,389.00 | 1,402.50 | 1,435.50 |
| Fibonacci | 1,306.25 | 1,324.01 | 1,334.99 | 1,352.75 | 1,370.51 | 1,381.49 | 1,399.25 |
| Pivot points | S3 | S2 | S1 | PP | R1 | R2 | R3 |
|---|---|---|---|---|---|---|---|
| Standard | 1,175.50 | 1,238.00 | 1,293.00 | 1,355.50 | 1,410.50 | 1,473.00 | 1,528.00 |
| Camarilla | 1,315.69 | 1,326.46 | 1,337.23 | 1,348.00 | 1,358.77 | 1,369.54 | 1,380.31 |
| Woodie | 1,171.75 | 1,236.13 | 1,289.25 | 1,353.63 | 1,406.75 | 1,471.13 | 1,524.25 |
| Fibonacci | 1,238.00 | 1,282.89 | 1,310.62 | 1,355.50 | 1,400.39 | 1,428.12 | 1,473.00 |
Numerical data
The following is the status of the technical indicators and moving averages at the time of publication of this technical analysis:
| RSI (14): | 54.01 | |
| MACD (12,26,9): | -6.5900 | |
| Directional Movement: | 4.95 | |
| AROON (14): | -35.71 | |
| DEMA (21): | 1,340.41 | |
| Parabolic SAR (0,02-0,02-0,2): | 1,323.00 | |
| Elder Ray (13): | 19.70 | |
| Super Trend (3,10): | 1,417.95 | |
| Zig ZAG (10): | 1,370.00 | |
| VORTEX (21): | 0.9700 | |
| Stochastique (14,3,5): | 66.36 | |
| TEMA (21): | 1,350.77 | |
| Williams %R (14): | -14.93 | |
| Chande Momentum Oscillator (20): | -8.50 | |
| Repulse (5,40,3): | 2.1100 | |
| ROCnROLL: | -1 | |
| TRIX (15,9): | -0.1100 | |
| Courbe Coppock: | 2.68 |
| MA7: | 1,346.32 | |
| MA20: | 1,352.53 | |
| MA50: | 1,371.48 | |
| MA100: | 1,434.80 | |
| MAexp7: | 1,351.81 | |
| MAexp20: | 1,352.04 | |
| MAexp50: | 1,377.92 | |
| MAexp100: | 1,389.64 | |
| Price / MA7: | +1.76% | |
| Price / MA20: | +1.29% | |
| Price / MA50: | -0.11% | |
| Price / MA100: | -4.52% | |
| Price / MAexp7: | +1.35% | |
| Price / MAexp20: | +1.33% | |
| Price / MAexp50: | -0.57% | |
| Price / MAexp100: | -1.41% |
News
The latest news and videos published on SOYBEAN at the time of the analysis were as follows:
-
 Ahead Of Trump-Xi Meeting, USDA Announces Huge Soybean Sale To China
-
Soybean farmer: We would like to have markets, not aid
-
Impact of tariffs on America's soybean farmers
-
Will Trump's Truce With China Help Soybean Sales?
-
U.S. Trade Gap Hits 10-Year High In October As Soybean Exports Continue To Fall
About author

Online


Add a comment
Comments
0 comments on the analysis SOYBEAN - Daily