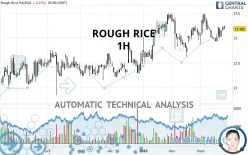
ROUGH RICE - 1H - Technical analysis published on 03/23/2021 (GMT)
- 298
- 0
Click here for a new analysis!
- Timeframe : 1H
- - Analysis generated on
- Status : TARGET REACHED

Summary of the analysis
Additional analysis
Quotes
The ROUGH RICE price is 13.185 USD. The price registered a decrease of -0.23% on the session and was between 13.175 USD and 13.250 USD. This implies that the price is at +0.08% from its lowest and at -0.49% from its highest.The Central Gaps scanner detects the formation of a bullish gap marking the strong presence of buyers against sellers at the opening. This formed a quotation gap.
Opening Gap UP
Type : Bullish
Timeframe : Openning
So that you have an overall view of the price change, here is a table showing the variations over several periods:
Technical
A technical analysis in 1H of this ROUGH RICE chart shows a bullish trend. The signals returned by the moving averages are 71.43% bullish. This bullish trend is reinforced by the strong signals currently being given by short-term moving averages. There is no crossing of moving average by the price or crossing of moving averages between themselves.
In fact, 16 technical indicators on 18 studied are currently positioned bullish. Caution: the Central Indicators scanner currently detects an excess:
RSI indicator is overbought : over 70
Type : Neutral
Timeframe : 1 hour
CCI indicator is overbought : over 100
Type : Neutral
Timeframe : 1 hour
CCI indicator: bullish divergence
Type : Bullish
Timeframe : 1 hour
MACD indicator: bearish divergence
Type : Bearish
Timeframe : 1 hour
MACD indicator: bullish divergence
Type : Bullish
Timeframe : 1 hour
RSI indicator: bearish divergence
Type : Bearish
Timeframe : 1 hour
Williams %R indicator is overbought : over -20
Type : Neutral
Timeframe : 1 hour
Pivot points : price is over resistance 2
Type : Neutral
Timeframe : 1 hour
Pivot points : price is under support 3
Type : Neutral
Timeframe : 1 hour
Price is back over the pivot point
Type : Bullish
Timeframe : Weekly
Price is back under the pivot point
Type : Bearish
Timeframe : Weekly
Central Patterns, the scanner specializing in chart patterns, did not identify any signals.
There is also a Japanese candlestick pattern detected by Central Candlesticks that could mark the end of the current short-term trend:
Doji
Type : Neutral
Timeframe : 1 hour
| S3 | S2 | S1 | Price | R1 | R2 | R3 | |
|---|---|---|---|---|---|---|---|
| ProTrendLines | 12.700 | 12.899 | 13.048 | 13.185 | 13.216 | 13.310 | 13.500 |
| Change (%) | -3.68% | -2.17% | -1.04% | - | +0.24% | +0.95% | +2.39% |
| Change | -0.485 | -0.286 | -0.137 | - | +0.031 | +0.125 | +0.315 |
| Level | Intermediate | Intermediate | Intermediate | - | Intermediate | Major | Intermediate |
To determine price objectives, it is also possible to use the pivot points. Here is the price position in relation to pivot points:
| Pivot points | S3 | S2 | S1 | PP | R1 | R2 | R3 |
|---|---|---|---|---|---|---|---|
| Standard | 13.063 | 13.097 | 13.163 | 13.197 | 13.263 | 13.297 | 13.363 |
| Camarilla | 13.203 | 13.212 | 13.221 | 13.230 | 13.239 | 13.248 | 13.258 |
| Woodie | 13.080 | 13.105 | 13.180 | 13.205 | 13.280 | 13.305 | 13.380 |
| Fibonacci | 13.097 | 13.135 | 13.159 | 13.197 | 13.235 | 13.259 | 13.297 |
| Pivot points | S3 | S2 | S1 | PP | R1 | R2 | R3 |
|---|---|---|---|---|---|---|---|
| Standard | 12.685 | 12.805 | 12.975 | 13.095 | 13.265 | 13.385 | 13.555 |
| Camarilla | 13.065 | 13.092 | 13.118 | 13.145 | 13.172 | 13.198 | 13.225 |
| Woodie | 12.710 | 12.818 | 13.000 | 13.108 | 13.290 | 13.398 | 13.580 |
| Fibonacci | 12.805 | 12.916 | 12.984 | 13.095 | 13.206 | 13.274 | 13.385 |
| Pivot points | S3 | S2 | S1 | PP | R1 | R2 | R3 |
|---|---|---|---|---|---|---|---|
| Standard | 11.868 | 12.242 | 12.663 | 13.037 | 13.458 | 13.832 | 14.253 |
| Camarilla | 12.866 | 12.939 | 13.012 | 13.085 | 13.158 | 13.231 | 13.304 |
| Woodie | 11.893 | 12.254 | 12.688 | 13.049 | 13.483 | 13.844 | 14.278 |
| Fibonacci | 12.242 | 12.545 | 12.733 | 13.037 | 13.340 | 13.528 | 13.832 |
Numerical data
The following is the status of the technical indicators and moving averages at the time of publication of this technical analysis:
| RSI (14): | 71.17 | |
| MACD (12,26,9): | 0.0400 | |
| Directional Movement: | 29.749 | |
| AROON (14): | 100.000 | |
| DEMA (21): | 13.185 | |
| Parabolic SAR (0,02-0,02-0,2): | 13.064 | |
| Elder Ray (13): | 0.045 | |
| Super Trend (3,10): | 13.084 | |
| Zig ZAG (10): | 13.230 | |
| VORTEX (21): | 1.0230 | |
| Stochastique (14,3,5): | 86.51 | |
| TEMA (21): | 13.211 | |
| Williams %R (14): | 0.00 | |
| Chande Momentum Oscillator (20): | 0.130 | |
| Repulse (5,40,3): | 0.3770 | |
| ROCnROLL: | 1 | |
| TRIX (15,9): | 0.0380 | |
| Courbe Coppock: | 2.17 |
| MA7: | 13.110 | |
| MA20: | 13.149 | |
| MA50: | 13.112 | |
| MA100: | 12.781 | |
| MAexp7: | 13.188 | |
| MAexp20: | 13.136 | |
| MAexp50: | 13.100 | |
| MAexp100: | 13.103 | |
| Price / MA7: | +0.57% | |
| Price / MA20: | +0.27% | |
| Price / MA50: | +0.56% | |
| Price / MA100: | +3.16% | |
| Price / MAexp7: | -0.02% | |
| Price / MAexp20: | +0.37% | |
| Price / MAexp50: | +0.65% | |
| Price / MAexp100: | +0.63% |
News
The last news published on ROUGH RICE at the time of the generation of this analysis was as follows:
-
 Ricardo Reis on One-Minute Insights: Bridging Monetary Policy Science and Practice
-
Riz Ahmed Searched at Airport Despite Being On Cover of Inflight Magazine
-
Tamir Rice's Mom Speaks Out On 2nd Anniversary Of Killing | NBC News
-
The Night Of's Riz Ahmed Says Airport Security "Attacked" Him in Emotional Essay
-
Tamir Rice case: Police-prosecutor relationship affects grand juries
About author

Online


Add a comment
Comments
0 comments on the analysis ROUGH RICE - 1H