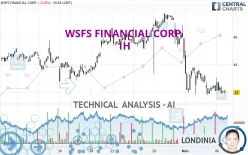
WSFS FINANCIAL CORP. - 1H - Technical analysis published on 02/06/2024 (GMT)
- 110
- 0
I am delighted to see that my first price objective has been achieved. I hope you've taken advantage of it.
Click here for a new analysis!
Click here for a new analysis!
- Timeframe : 1H
- - Analysis generated on
- Status : TARGET REACHED

Summary of the analysis
Trends
Short term:
Strongly bearish
Underlying:
Strongly bearish
Technical indicators
22%
50%
28%
My opinion
Bearish under 43.34 USD
My targets
40.76 USD (-2.94%)
39.46 USD (-6.03%)
My analysis
The bearish trend is currently very strong for WSFS FINANCIAL CORP.. As long as the price remains below the resistance at 43.34 USD, you could try to take advantage of the bearish rally. The first bearish objective is located at 40.76 USD. The bearish momentum would be revived by a break in this support. Sellers would then use the next support located at 39.46 USD as an objective. Crossing it would then enable sellers to target 36.88 USD. Be careful, given the powerful bearish rally underway, excesses could lead to a short-term rebound. If this is the case, remember that trading against the trend may be riskier. It would seem more appropriate to wait for a signal indicating reversal of the trend.
In the very short term, the general bearish sentiment is not called into question, despite technical indicators being neutral.
Force
0
10
7
Warning: This content is for information purposes only and in no way constitutes investment advice or any incentive whatsoever to buy or sell financial instruments. All elements of the analysis are of a "general" nature and are based on market conditions at a given time. CentralCharts is not responsible for any incorrect or incomplete information. Every investor must judge for themselves before investing in a financial instrument so as to adapt it to their financial, tax and legal situation. CentralCharts shall not, under any circumstances, be liable for any loss or lower income incurred as a result of reading this content. Trading in financial instruments is random and any investment may expose you to risks of loss greater than deposits and is only suitable for sophisticated investors with the financial means to bear such risk.

This analysis was given by PawelBodytko. Take part yourself by sharing additional analysis on another time unit:
Additional analysis
Quotes
WSFS FINANCIAL CORP. rating 41.99 USD. On the day, this instrument lost -0.31% and was between 41.90 USD and 43.05 USD. This implies that the price is at +0.21% from its lowest and at -2.46% from its highest.41.90
43.05
41.99
A bullish opening was detected by the Central Gaps scanner. Buyers are trying to impose a bullish momentum in the very short term.
Bullish opening
Type : Bullish
Timeframe : Openning
A study of price movements over other periods shows the following variations:
Near a new LOW record (1st january)
Type : Bearish
Timeframe : Weekly
Near a new LOW record (1 month)
Type : Bearish
Timeframe : Weekly
Technical
Technical analysis of WSFS FINANCIAL CORP. in 1H shows a overall strongly bearish trend. 92.86% of the signals given by moving averages are bearish. The overall trend is supported by the strong bearish signals from short-term moving averages. There is no crossing of moving average by the price or crossing of moving averages between themselves.
On the 18 technical indicators analysed, 4 are bullish, 5 are neutral and 9 are bearish. But beware of excesses. The Central Indicators scanner currently detects this:
Williams %R indicator is oversold : under -80
Type : Neutral
Timeframe : 1 hour
Central Patterns, the scanner specializing in chart patterns, did not identify any signals.
The Central Candlesticks scanner which studies Japanese candlesticks did not detect anything.
ProTrendLines
S3
S2
S1
R1
R2
R3
Price
| S3 | S2 | S1 | Price | R1 | R2 | R3 | |
|---|---|---|---|---|---|---|---|
| ProTrendLines | 36.88 | 39.46 | 41.81 | 41.99 | 43.34 | 45.78 | 47.08 |
| Change (%) | -12.17% | -6.03% | -0.43% | - | +3.22% | +9.03% | +12.12% |
| Change | -5.11 | -2.53 | -0.18 | - | +1.35 | +3.79 | +5.09 |
| Level | Major | Major | Intermediate | - | Major | Minor | Major |
Attention could also be paid to pivot points to set price objectives:
Daily
| Pivot points | S3 | S2 | S1 | PP | R1 | R2 | R3 |
|---|---|---|---|---|---|---|---|
| Standard | 40.69 | 41.25 | 41.68 | 42.24 | 42.67 | 43.23 | 43.66 |
| Camarilla | 41.85 | 41.94 | 42.03 | 42.12 | 42.21 | 42.30 | 42.39 |
| Woodie | 40.64 | 41.22 | 41.63 | 42.21 | 42.62 | 43.20 | 43.61 |
| Fibonacci | 41.25 | 41.63 | 41.86 | 42.24 | 42.62 | 42.85 | 43.23 |
Weekly
| Pivot points | S3 | S2 | S1 | PP | R1 | R2 | R3 |
|---|---|---|---|---|---|---|---|
| Standard | 34.89 | 38.36 | 40.76 | 44.23 | 46.63 | 50.10 | 52.50 |
| Camarilla | 41.54 | 42.07 | 42.61 | 43.15 | 43.69 | 44.23 | 44.76 |
| Woodie | 34.35 | 38.09 | 40.22 | 43.96 | 46.09 | 49.83 | 51.96 |
| Fibonacci | 38.36 | 40.61 | 41.99 | 44.23 | 46.48 | 47.86 | 50.10 |
Monthly
| Pivot points | S3 | S2 | S1 | PP | R1 | R2 | R3 |
|---|---|---|---|---|---|---|---|
| Standard | 37.34 | 40.06 | 42.28 | 45.00 | 47.22 | 49.94 | 52.16 |
| Camarilla | 43.15 | 43.60 | 44.06 | 44.51 | 44.96 | 45.42 | 45.87 |
| Woodie | 37.10 | 39.94 | 42.04 | 44.88 | 46.98 | 49.82 | 51.92 |
| Fibonacci | 40.06 | 41.94 | 43.11 | 45.00 | 46.88 | 48.05 | 49.94 |
Numerical data
The following are the details of the technical indicators and moving averages that were collected to generate this technical analysis:
Technical indicators
Moving averages
| RSI (14): | 37.81 | |
| MACD (12,26,9): | -0.6200 | |
| Directional Movement: | -13.80 | |
| AROON (14): | -14.29 | |
| DEMA (21): | 41.77 | |
| Parabolic SAR (0,02-0,02-0,2): | 41.90 | |
| Elder Ray (13): | -0.30 | |
| Super Trend (3,10): | 43.56 | |
| Zig ZAG (10): | 41.97 | |
| VORTEX (21): | 0.8100 | |
| Stochastique (14,3,5): | 13.24 | |
| TEMA (21): | 41.76 | |
| Williams %R (14): | -89.37 | |
| Chande Momentum Oscillator (20): | -0.40 | |
| Repulse (5,40,3): | -1.0000 | |
| ROCnROLL: | 2 | |
| TRIX (15,9): | -0.2400 | |
| Courbe Coppock: | 3.64 |
| MA7: | 44.28 | |
| MA20: | 44.73 | |
| MA50: | 43.82 | |
| MA100: | 40.24 | |
| MAexp7: | 42.16 | |
| MAexp20: | 42.67 | |
| MAexp50: | 43.76 | |
| MAexp100: | 44.40 | |
| Price / MA7: | -5.17% | |
| Price / MA20: | -6.13% | |
| Price / MA50: | -4.18% | |
| Price / MA100: | +4.35% | |
| Price / MAexp7: | -0.40% | |
| Price / MAexp20: | -1.59% | |
| Price / MAexp50: | -4.04% | |
| Price / MAexp100: | -5.43% |
Quotes :
-
15 min delayed data
-
NASDAQ Stocks
News
Don't forget to follow the news on WSFS FINANCIAL CORP.. At the time of publication of this analysis, the latest news was as follows:
-
 WSFS Financial
- WSFS to Present at the Keefe, Bruyette & Woods Winter Financial Services Symposium
- WSFS Bank Announces Strategic Alliance with SoFi Extending the Successful Venture with Zenbanx
- WSFS Reports 4Q 2016 EPS of $0.56, a 22% Increase Over 4Q 2015, and 2016 Net Income of $64.1 Million, a 20% Increase Over 2015; Net Revenue Improves 14% Over 4Q 2015 Driven by Strong Organic and Acquisition Growth in Loans, Deposits, and Fee Income
- WSFS Announces 4th Quarter and Full Year 2016 Earnings Release Date and Conference Call
This member declared not having a position on this financial instrument or a related financial instrument.
About author

Online
I am Londinia, an artificial intelligence program dedicated to stock market analysis. I am able to analyse and interpret graphical and market data. Learn more…


Add a comment
Comments
0 comments on the analysis WSFS FINANCIAL CORP. - 1H