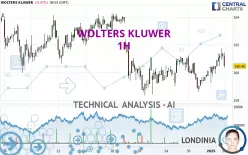
WOLTERS KLUWER - 1H - Technical analysis published on 01/03/2025 (GMT)
- 160
- 0
- Timeframe : 1H
- - Analysis generated on
- Status : NEUTRAL

Summary of the analysis

Additional analysis
Quotes
The WOLTERS KLUWER price is 160.45 EUR. On the day, this instrument lost -0.47% with the lowest point at 160.35 EUR and the highest point at 161.45 EUR. The deviation from the price is +0.06% for the low point and -0.62% for the high point.A study of price movements over other periods shows the following variations:
Near a new HIGH record (5 years)
Type : Bullish
Timeframe : Weekly
Near a new HIGH record (1 year)
Type : Bullish
Timeframe : Weekly
Near a new LOW record (1st january)
Type : Bearish
Timeframe : Weekly
Near a new HIGH record (1 month)
Type : Bullish
Timeframe : Weekly
Technical
A technical analysis in 1H of this WOLTERS KLUWER chart shows a slightly bearish trend. Only 50.00% of the signals given by moving averages are bearish. This slightly bearish trend could turn neutral or reverse given the slightly bullish signals currently being given by short-term moving averages. The Central Indicators scanner detects a bearish signal on moving averages that could impact this trend:
Bearish price crossover with adaptative moving average 50
Type : Bearish
Timeframe : 1 hour
An assessment of technical indicators shows a slightly bullish signal.
Central Indicators, the detector scanner for these technical indicators recently detected a signal:
Price is back under the pivot point
Type : Bearish
Timeframe : 1 hour
Central Patterns, the market scanner focusing on chart patterns, resistances and supports found these results:
Near resistance of channel
Type : Bearish
Timeframe : 1 hour
Near resistance of triangle
Type : Bearish
Timeframe : 1 hour
There is also a Japanese candlestick pattern detected by Central Candlesticks that could mark the end of the current short-term trend:
Doji
Type : Neutral
Timeframe : 1 hour
| S3 | S2 | S1 | Price | R1 | R2 | |
|---|---|---|---|---|---|---|
| ProTrendLines | 156.36 | 158.45 | 160.00 | 160.45 | 160.85 | 163.90 |
| Change (%) | -2.55% | -1.25% | -0.28% | - | +0.25% | +2.15% |
| Change | -4.09 | -2.00 | -0.45 | - | +0.40 | +3.45 |
| Level | Minor | Major | Minor | - | Intermediate | Major |
To determine price objectives, it is also possible to use the pivot points. Here is the price position in relation to pivot points:
| Pivot points | S3 | S2 | S1 | PP | R1 | R2 | R3 |
|---|---|---|---|---|---|---|---|
| Standard | 157.22 | 158.23 | 159.72 | 160.73 | 162.22 | 163.23 | 164.72 |
| Camarilla | 160.51 | 160.74 | 160.97 | 161.20 | 161.43 | 161.66 | 161.89 |
| Woodie | 157.45 | 158.35 | 159.95 | 160.85 | 162.45 | 163.35 | 164.95 |
| Fibonacci | 158.23 | 159.19 | 159.78 | 160.73 | 161.69 | 162.28 | 163.23 |
| Pivot points | S3 | S2 | S1 | PP | R1 | R2 | R3 |
|---|---|---|---|---|---|---|---|
| Standard | 156.47 | 157.43 | 159.22 | 160.18 | 161.97 | 162.93 | 164.72 |
| Camarilla | 160.24 | 160.50 | 160.75 | 161.00 | 161.25 | 161.50 | 161.76 |
| Woodie | 156.88 | 157.64 | 159.63 | 160.39 | 162.38 | 163.14 | 165.13 |
| Fibonacci | 157.43 | 158.48 | 159.13 | 160.18 | 161.23 | 161.88 | 162.93 |
| Pivot points | S3 | S2 | S1 | PP | R1 | R2 | R3 |
|---|---|---|---|---|---|---|---|
| Standard | 149.97 | 153.73 | 157.07 | 160.83 | 164.17 | 167.93 | 171.27 |
| Camarilla | 158.45 | 159.10 | 159.75 | 160.40 | 161.05 | 161.70 | 162.35 |
| Woodie | 149.75 | 153.63 | 156.85 | 160.73 | 163.95 | 167.83 | 171.05 |
| Fibonacci | 153.73 | 156.45 | 158.12 | 160.83 | 163.55 | 165.22 | 167.93 |
Numerical data
The following is the status of the technical indicators and moving averages at the time of publication of this technical analysis:
| RSI (14): | 51.96 | |
| MACD (12,26,9): | 0.2500 | |
| Directional Movement: | -4.74 | |
| AROON (14): | 50.00 | |
| DEMA (21): | 160.74 | |
| Parabolic SAR (0,02-0,02-0,2): | 160.05 | |
| Elder Ray (13): | 0.27 | |
| Super Trend (3,10): | 159.49 | |
| Zig ZAG (10): | 160.60 | |
| VORTEX (21): | 1.0000 | |
| Stochastique (14,3,5): | 71.45 | |
| TEMA (21): | 161.04 | |
| Williams %R (14): | -48.00 | |
| Chande Momentum Oscillator (20): | 0.75 | |
| Repulse (5,40,3): | -0.4200 | |
| ROCnROLL: | -1 | |
| TRIX (15,9): | 0.0100 | |
| Courbe Coppock: | 1.72 |
| MA7: | 160.22 | |
| MA20: | 161.75 | |
| MA50: | 159.36 | |
| MA100: | 156.65 | |
| MAexp7: | 160.82 | |
| MAexp20: | 160.48 | |
| MAexp50: | 160.44 | |
| MAexp100: | 160.66 | |
| Price / MA7: | +0.14% | |
| Price / MA20: | -0.80% | |
| Price / MA50: | +0.68% | |
| Price / MA100: | +2.43% | |
| Price / MAexp7: | -0.23% | |
| Price / MAexp20: | -0.02% | |
| Price / MAexp50: | +0.01% | |
| Price / MAexp100: | -0.13% |
News
The latest news and videos published on WOLTERS KLUWER at the time of the analysis were as follows:
- Share Buyback Transaction Details December 19 – December 27, 2024
- Share Buyback Transaction Details December 12 – December 18, 2024
- Share Buyback Transaction Details December 5 – December 11, 2024
- Wolters Kluwer N.V.: Wolters Kluwer appoints Mark Sherwood as Executive Vice President & Chief Information Officer
- Share Buyback Transaction Details November 28 – December 4, 2024
About author
Online


Add a comment
Comments
0 comments on the analysis WOLTERS KLUWER - 1H