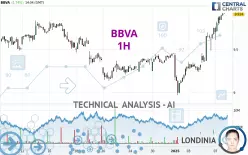
BBVA - 1H - Technical analysis published on 01/07/2025 (GMT)
- 112
- 0
Click here for a new analysis!
- Timeframe : 1H
- - Analysis generated on
- Status : TARGET REACHED

Summary of the analysis

Additional analysis
Quotes
The BBVA price is 9.914 EUR. The price registered an increase of +1.75% on the session with the lowest point at 9.606 EUR and the highest point at 9.920 EUR. The deviation from the price is +3.21% for the low point and -0.06% for the high point.A study of price movements over other periods shows the following variations:
New HIGH record (1st january)
Type : Bullish
Timeframe : Weekly
New HIGH record (1 month)
Type : Bullish
Timeframe : Weekly
Technical
A technical analysis in 1H of this BBVA chart shows a strongly bullish trend. The signals given by the moving averages are 92.86% bullish. This strong bullish trend is confirmed by the strong signals currently being given by short-term moving averages. There is no crossing of moving average by the price or crossing of moving averages between themselves.
An assessment of technical indicators shows a strong bullish signal.
Caution: the Central Indicators scanner currently detects an excess:
RSI indicator is overbought : over 70
Type : Neutral
Timeframe : 1 hour
CCI indicator is overbought : over 100
Type : Neutral
Timeframe : 1 hour
Williams %R indicator is overbought : over -20
Type : Neutral
Timeframe : 1 hour
Pivot points : price is over resistance 1
Type : Neutral
Timeframe : 1 hour
Pivot points : price is over resistance 2
Type : Neutral
Timeframe : Weekly
The Central Patterns scanner, which studies chart patterns, resistances and supports, has identified these signals:
Near horizontal resistance
Type : Bearish
Timeframe : 1 hour
Resistance of channel is broken
Type : Bullish
Timeframe : 1 hour
The Central Candlesticks scanner which studies Japanese candlesticks did not detect anything.
| S3 | S2 | S1 | Price | R1 | |
|---|---|---|---|---|---|
| ProTrendLines | 9.484 | 9.616 | 9.888 | 9.914 | 10.654 |
| Change (%) | -4.34% | -3.01% | -0.26% | - | +7.46% |
| Change | -0.430 | -0.298 | -0.026 | - | +0.740 |
| Level | Minor | Major | Major | - | Major |
Attention could also be paid to pivot points to set price objectives:
| Pivot points | S3 | S2 | S1 | PP | R1 | R2 | R3 |
|---|---|---|---|---|---|---|---|
| Standard | 9.066 | 9.204 | 9.474 | 9.612 | 9.882 | 10.020 | 10.290 |
| Camarilla | 9.632 | 9.669 | 9.707 | 9.744 | 9.781 | 9.819 | 9.856 |
| Woodie | 9.132 | 9.237 | 9.540 | 9.645 | 9.948 | 10.053 | 10.356 |
| Fibonacci | 9.204 | 9.360 | 9.456 | 9.612 | 9.768 | 9.864 | 10.020 |
| Pivot points | S3 | S2 | S1 | PP | R1 | R2 | R3 |
|---|---|---|---|---|---|---|---|
| Standard | 8.553 | 8.759 | 9.039 | 9.245 | 9.525 | 9.731 | 10.011 |
| Camarilla | 9.184 | 9.229 | 9.274 | 9.318 | 9.363 | 9.407 | 9.452 |
| Woodie | 8.589 | 8.778 | 9.075 | 9.264 | 9.561 | 9.750 | 10.047 |
| Fibonacci | 8.759 | 8.945 | 9.060 | 9.245 | 9.431 | 9.546 | 9.731 |
| Pivot points | S3 | S2 | S1 | PP | R1 | R2 | R3 |
|---|---|---|---|---|---|---|---|
| Standard | 7.906 | 8.368 | 8.910 | 9.372 | 9.914 | 10.376 | 10.918 |
| Camarilla | 9.176 | 9.268 | 9.360 | 9.452 | 9.544 | 9.636 | 9.728 |
| Woodie | 7.946 | 8.388 | 8.950 | 9.392 | 9.954 | 10.396 | 10.958 |
| Fibonacci | 8.368 | 8.752 | 8.989 | 9.372 | 9.756 | 9.993 | 10.376 |
Numerical data
The following are the details of the technical indicators and moving averages that were collected to generate this technical analysis:
| RSI (14): | 76.07 | |
| MACD (12,26,9): | 0.1490 | |
| Directional Movement: | 20.314 | |
| AROON (14): | 100.000 | |
| DEMA (21): | 9.820 | |
| Parabolic SAR (0,02-0,02-0,2): | 9.642 | |
| Elder Ray (13): | 0.177 | |
| Super Trend (3,10): | 9.644 | |
| Zig ZAG (10): | 9.906 | |
| VORTEX (21): | 1.3090 | |
| Stochastique (14,3,5): | 96.37 | |
| TEMA (21): | 9.919 | |
| Williams %R (14): | -2.47 | |
| Chande Momentum Oscillator (20): | 0.534 | |
| Repulse (5,40,3): | 1.2150 | |
| ROCnROLL: | 1 | |
| TRIX (15,9): | 0.1780 | |
| Courbe Coppock: | 9.90 |
| MA7: | 9.496 | |
| MA20: | 9.508 | |
| MA50: | 9.302 | |
| MA100: | 9.228 | |
| MAexp7: | 9.818 | |
| MAexp20: | 9.640 | |
| MAexp50: | 9.489 | |
| MAexp100: | 9.437 | |
| Price / MA7: | +4.40% | |
| Price / MA20: | +4.27% | |
| Price / MA50: | +6.58% | |
| Price / MA100: | +7.43% | |
| Price / MAexp7: | +0.98% | |
| Price / MAexp20: | +2.84% | |
| Price / MAexp50: | +4.48% | |
| Price / MAexp100: | +5.05% |
News
Don't forget to follow the news on BBVA. At the time of publication of this analysis, the latest news was as follows:
- Banco BBVA Argentina S.A. Announces Third Quarter 2024 Results
- Banco BBVA Argentina S.A. announces Second Quarter 2024 results
- BBVA Argentina announces Second Quarter 2024 Financial Results Schedule
- Banco BBVA Argentina S.A. announced payment of installment 3 of 3 of dividend payment schedule
- Banco BBVA Argentina S.A. announced payment of installment 2 of 3 of dividend payment schedule
About author
Online


Add a comment
Comments
0 comments on the analysis BBVA - 1H