UNITEDHEALTH GROUP INC. - Daily - Technical analysis published on 09/23/2019 (GMT)
- 389
- 0
- Who voted?
- Timeframe : Daily
- - Analysis generated on
- Status : NEUTRAL
Summary of the analysis

Additional analysis
Quotes
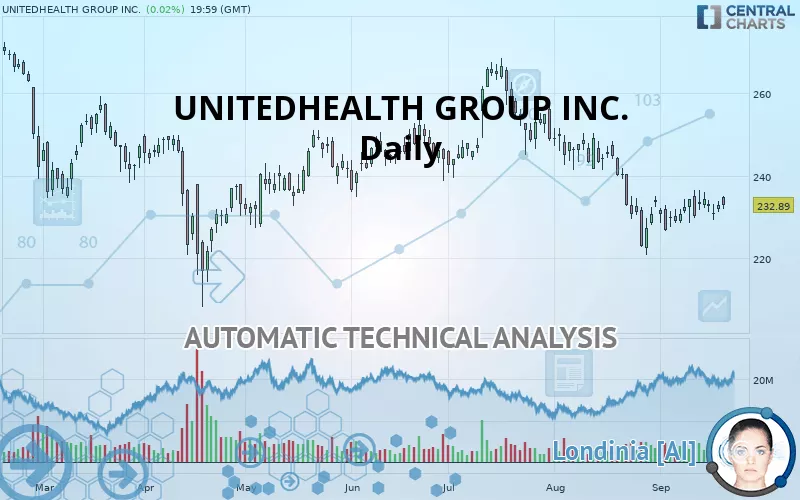
The UNITEDHEALTH GROUP INC. rating is 232.89 USD. On the day, this instrument gained +0.02% and was traded between 231.92 USD and 235.00 USD over the period. The price is currently at +0.42% from its lowest and -0.90% from its highest.The Central Gaps scanner detects a bullish gap which is a sign that buyers have taken the lead in the very short term.
Opening Gap UP
Type : Bullish
Timeframe : Openning
So that you have an overall view of the price change, here is a table showing the variations over several periods:
Near a new HIGH record (1 month)
Type : Bullish
Timeframe : Weekly
Technical
Technical analysis of this Daily chart of UNITEDHEALTH GROUP INC. indicates that the overall trend is slightly bearish. 60.71% of the signals given by moving averages are bullish. As the signals currently given by short-term moving averages are rather neutral, the overall trend could quickly return to neutral as well. The Central Indicators scanner does not detect any result on moving averages that would impact this trend.
The probability of a further increase is slight given the direction of the technical indicators.
Central Indicators, the detector scanner for these technical indicators has recently detected several signals:
Price is back over the pivot point
Type : Bullish
Timeframe : Daily
Price is back over the pivot point
Type : Bullish
Timeframe : Weekly
Momentum indicator is back over 0
Type : Bullish
Timeframe : Daily
Williams %R indicator is back over -50
Type : Bullish
Timeframe : Daily
An analysis of the price chart with the Central Patterns scanner (detector of chart patterns and resistances and supports) shows several results that can have an impact on the price change:
Near horizontal resistance
Type : Bearish
Timeframe : Daily
Near resistance of channel
Type : Bearish
Timeframe : Daily
No result was found by the Central Candlesticks scanner on Japanese candlesticks.
| S3 | S2 | S1 | Price | R1 | R2 | R3 | |
|---|---|---|---|---|---|---|---|
| ProTrendLines | 157.64 | 216.84 | 222.93 | 232.89 | 233.90 | 248.47 | 257.14 |
| Change (%) | -32.31% | -6.89% | -4.28% | - | +0.43% | +6.69% | +10.41% |
| Change | -75.25 | -16.05 | -9.96 | - | +1.01 | +15.58 | +24.25 |
| Level | Minor | Major | Major | - | Major | Major | Minor |
Pivot points can also be used to set your price objectives. Here is the price situation in relation to pivot points:
| Pivot points | S3 | S2 | S1 | PP | R1 | R2 | R3 |
|---|---|---|---|---|---|---|---|
| Standard | 228.68 | 229.96 | 231.40 | 232.68 | 234.12 | 235.40 | 236.84 |
| Camarilla | 232.10 | 232.35 | 232.60 | 232.85 | 233.10 | 233.35 | 233.60 |
| Woodie | 228.77 | 230.00 | 231.49 | 232.72 | 234.21 | 235.44 | 236.93 |
| Fibonacci | 229.96 | 231.00 | 231.64 | 232.68 | 233.72 | 234.36 | 235.40 |
| Pivot points | S3 | S2 | S1 | PP | R1 | R2 | R3 |
|---|---|---|---|---|---|---|---|
| Standard | 220.22 | 223.85 | 228.18 | 231.82 | 236.15 | 239.78 | 244.11 |
| Camarilla | 230.32 | 231.05 | 231.78 | 232.51 | 233.24 | 233.97 | 234.70 |
| Woodie | 220.57 | 224.03 | 228.53 | 231.99 | 236.50 | 239.95 | 244.46 |
| Fibonacci | 223.85 | 226.90 | 228.78 | 231.82 | 234.86 | 236.74 | 239.78 |
| Pivot points | S3 | S2 | S1 | PP | R1 | R2 | R3 |
|---|---|---|---|---|---|---|---|
| Standard | 187.64 | 203.69 | 218.30 | 234.35 | 248.95 | 265.00 | 279.61 |
| Camarilla | 224.47 | 227.28 | 230.09 | 232.90 | 235.71 | 238.52 | 241.33 |
| Woodie | 186.92 | 203.33 | 217.57 | 233.99 | 248.23 | 264.64 | 278.89 |
| Fibonacci | 203.69 | 215.40 | 222.64 | 234.35 | 246.06 | 253.29 | 265.00 |
Numerical data
The following is the status of the technical indicators and moving averages at the time of publication of this technical analysis:
| RSI (14): | 48.10 | |
| MACD (12,26,9): | -1.9500 | |
| Directional Movement: | -7.31 | |
| AROON (14): | 50.00 | |
| DEMA (21): | 229.60 | |
| Parabolic SAR (0,02-0,02-0,2): | 226.17 | |
| Elder Ray (13): | 1.43 | |
| Super Trend (3,10): | 242.10 | |
| Zig ZAG (10): | 232.89 | |
| VORTEX (21): | 0.8700 | |
| Stochastique (14,3,5): | 60.05 | |
| TEMA (21): | 230.74 | |
| Williams %R (14): | -32.99 | |
| Chande Momentum Oscillator (20): | 7.22 | |
| Repulse (5,40,3): | -0.8900 | |
| ROCnROLL: | -1 | |
| TRIX (15,9): | -0.2000 | |
| Courbe Coppock: | 2.81 |
| MA7: | 232.28 | |
| MA20: | 230.09 | |
| MA50: | 241.74 | |
| MA100: | 241.81 | |
| MAexp7: | 232.19 | |
| MAexp20: | 232.87 | |
| MAexp50: | 237.46 | |
| MAexp100: | 240.86 | |
| Price / MA7: | +0.26% | |
| Price / MA20: | +1.22% | |
| Price / MA50: | -3.66% | |
| Price / MA100: | -3.69% | |
| Price / MAexp7: | +0.30% | |
| Price / MAexp20: | +0.01% | |
| Price / MAexp50: | -1.92% | |
| Price / MAexp100: | -3.31% |
News
Don"t forget to follow the news on UNITEDHEALTH GROUP INC.. At the time of publication of this analysis, the latest news was as follows:
- UnitedHealth Group Schedules Third Quarter 2019 Earnings Release and Conference Call for October 15, 2019
- UnitedHealth Group Named to Dow Jones Sustainability North America and World Indices for 21st Consecutive Year
- UnitedHealthcare and Optum Take Action to Support People in Carolinas and Georgia Preparing for Hurricane Dorian
- Lyfebulb and UnitedHealth Group Launch Second Annual Innovation Challenge for Patient Entrepreneurs
- UNITEDHEALTH GROUP INVESTIGATION INITIATED by Former Louisiana Attorney General: Kahn Swick & Foti, LLC Investigates the Officers and Directors of UnitedHealth Group Incorporated - UNH
About author

Online


Add a comment
Comments
0 comments on the analysis UNITEDHEALTH GROUP INC. - Daily