| Open: | 58.6 |
| Change: | +0.1 |
| Volume: | 10,603 |
| Low: | 58.1 |
| High: | 58.6 |
| High / Low range: | 0.5 |
| Type: | Stocks |
| Ticker: | TRI |
| ISIN: | FR0005691656 |
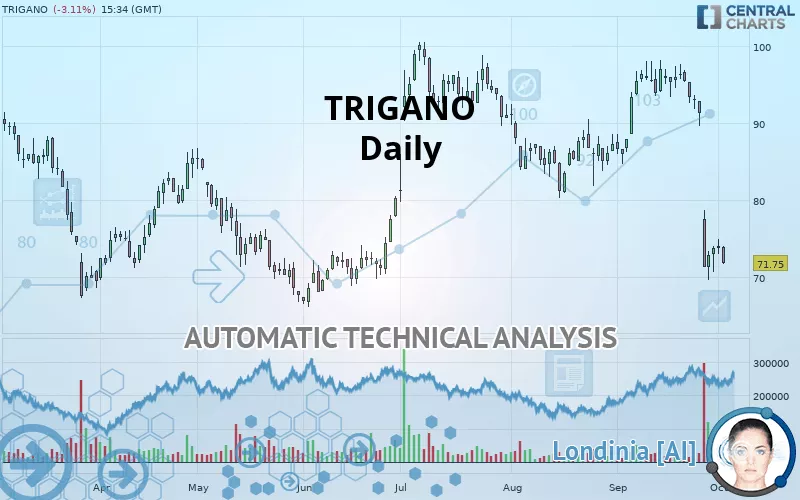
TRIGANO - Daily - Technical analysis published on 10/02/2019 (GMT)
- 323
- 0
- 10/02/2019 - 22:37
- Who voted?
Click here for a new analysis!
- Timeframe : Daily
- - Analysis generated on 10/02/2019 - 22:34
- Status : INVALID

Summary of the analysis

Additional analysis
Quotes
The TRIGANO rating is 71.75 EUR. On the day, this instrument lost -3.11% with the lowest point at 71.70 EUR and the highest point at 74.00 EUR. The deviation from the price is +0.07% for the low point and -3.04% for the high point.The Central Gaps scanner detects a bearish opening marking the presence of sellers ahead of buyers at the opening but not sufficiently marked to allow the price to register a quotation gap.
Bearish opening
Type : Bearish
Timeframe : Openning
A study of price movements over other periods shows the following variations:
Near a new LOW record (1 month)
Type : Bearish
Timeframe : Weekly
Abnormal volumes on TRIGANO were detected by the Central Volumes scanner:
Abnormal volumes
Timeframe : 5 days
Technical
Technical analysis of this Daily chart of TRIGANO indicates that the overall trend is bearish. 78.57% of the signals given by moving averages are bearish. The overall trend is reinforced by the strong bearish signals from short-term moving averages. The Central Indicators scanner does not detect any result on moving averages that would impact this trend.
The probability of a further decline is high given the direction of the technical indicators.
Caution: the Central Indicators scanner currently detects an excess:
RSI indicator is oversold : under 30
Type : Neutral
Timeframe : Daily
CCI indicator is oversold : under -100
Type : Neutral
Timeframe : Daily
Williams %R indicator is oversold : under -80
Type : Neutral
Timeframe : Daily
Pivot points : price is under support 3
Type : Neutral
Timeframe : Daily
Price is back over the pivot point
Type : Bullish
Timeframe : Daily
Price is back under the pivot point
Type : Bearish
Timeframe : Weekly
The Central Patterns scanner, which studies chart patterns, resistances and supports, has identified this signal:
Support of channel is broken
Type : Bearish
Timeframe : Daily
The Central Candlesticks scanner which studies Japanese candlesticks did not detect anything.
| S3 | S2 | S1 | Price | R1 | R2 | R3 | |
|---|---|---|---|---|---|---|---|
| ProTrendLines | 46.87 | 61.81 | 67.50 | 71.75 | 72.91 | 75.47 | 85.81 |
| Change (%) | -34.68% | -13.85% | -5.92% | - | +1.62% | +5.18% | +19.60% |
| Change | -24.88 | -9.94 | -4.25 | - | +1.16 | +3.72 | +14.06 |
| Level | Major | Intermediate | Minor | - | Major | Minor | Major |
Pivot points can also be used to set your price objectives. Here is the price situation in relation to pivot points:
| Pivot points | S3 | S2 | S1 | PP | R1 | R2 | R3 |
|---|---|---|---|---|---|---|---|
| Standard | 71.08 | 72.02 | 73.03 | 73.97 | 74.98 | 75.92 | 76.93 |
| Camarilla | 73.51 | 73.69 | 73.87 | 74.05 | 74.23 | 74.41 | 74.59 |
| Woodie | 71.13 | 72.04 | 73.08 | 73.99 | 75.03 | 75.94 | 76.98 |
| Fibonacci | 72.02 | 72.76 | 73.22 | 73.97 | 74.71 | 75.17 | 75.92 |
| Pivot points | S3 | S2 | S1 | PP | R1 | R2 | R3 |
|---|---|---|---|---|---|---|---|
| Standard | 37.55 | 53.60 | 63.20 | 79.25 | 88.85 | 104.90 | 114.50 |
| Camarilla | 65.75 | 68.10 | 70.45 | 72.80 | 75.15 | 77.50 | 79.85 |
| Woodie | 34.33 | 51.99 | 59.98 | 77.64 | 85.63 | 103.29 | 111.28 |
| Fibonacci | 53.60 | 63.40 | 69.45 | 79.25 | 89.05 | 95.10 | 104.90 |
| Pivot points | S3 | S2 | S1 | PP | R1 | R2 | R3 |
|---|---|---|---|---|---|---|---|
| Standard | 34.45 | 52.05 | 62.90 | 80.50 | 91.35 | 108.95 | 119.80 |
| Camarilla | 65.93 | 68.53 | 71.14 | 73.75 | 76.36 | 78.97 | 81.57 |
| Woodie | 31.08 | 50.36 | 59.53 | 78.81 | 87.98 | 107.26 | 116.43 |
| Fibonacci | 52.05 | 62.92 | 69.63 | 80.50 | 91.37 | 98.08 | 108.95 |
Numerical data
The following are the details of the technical indicators and moving averages that were collected to generate this technical analysis:
| RSI (14): | 26.19 | |
| MACD (12,26,9): | -4.1700 | |
| Directional Movement: | -31.86 | |
| AROON (14): | -71.43 | |
| DEMA (21): | 80.89 | |
| Parabolic SAR (0,02-0,02-0,2): | 88.26 | |
| Elder Ray (13): | -9.57 | |
| Super Trend (3,10): | 84.48 | |
| Zig ZAG (10): | 71.75 | |
| VORTEX (21): | 0.9300 | |
| Stochastique (14,3,5): | 12.42 | |
| TEMA (21): | 76.37 | |
| Williams %R (14): | -92.62 | |
| Chande Momentum Oscillator (20): | -24.30 | |
| Repulse (5,40,3): | -3.9200 | |
| ROCnROLL: | 2 | |
| TRIX (15,9): | -0.1600 | |
| Courbe Coppock: | 33.85 |
| MA7: | 78.30 | |
| MA20: | 89.41 | |
| MA50: | 88.15 | |
| MA100: | 84.06 | |
| MAexp7: | 77.75 | |
| MAexp20: | 84.96 | |
| MAexp50: | 86.95 | |
| MAexp100: | 85.71 | |
| Price / MA7: | -8.37% | |
| Price / MA20: | -19.75% | |
| Price / MA50: | -18.60% | |
| Price / MA100: | -14.64% | |
| Price / MAexp7: | -7.72% | |
| Price / MAexp20: | -15.55% | |
| Price / MAexp50: | -17.48% | |
| Price / MAexp100: | -16.29% |
About author

Online


Add a comment
Comments
0 comments on the analysis TRIGANO - Daily