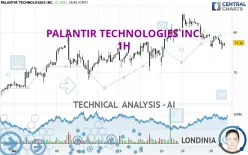
PALANTIR TECHNOLOGIES INC. - 1H - Technical analysis published on 12/31/2024 (GMT)
- 214
- 0
Click here for a new analysis!
- Timeframe : 1H
- - Analysis generated on
- Status : TARGET REACHED

Summary of the analysis

Additional analysis
Quotes
The PALANTIR TECHNOLOGIES INC. rating is 77.32 USD. The price has increased by +0.18% since the last closing and was between 75.67 USD and 77.98 USD. This implies that the price is at +2.18% from its lowest and at -0.85% from its highest.So that you have an overall view of the price change, here is a table showing the variations over several periods:
Technical
Technical analysis of PALANTIR TECHNOLOGIES INC. in 1H shows an overall slightly bullish trend. 53.57% of the signals given by moving averages are bullish. Caution: a reversal of the trend could be possible given the strong bearish signals of short-term moving averages. The Central Indicators market scanner is currently detecting several bearish and bullish signals that could impact this trend:
Moving Average bearish crossovers : MA20 & MA50
Type : Bearish
Timeframe : 1 hour
Bullish price crossover with adaptative moving average 100
Type : Bullish
Timeframe : 1 hour
The probability of a further decline is high given the direction of the technical indicators.
Caution: the Central Indicators scanner currently detects an excess:
CCI indicator: bullish divergence
Type : Bullish
Timeframe : 1 hour
The Central Patterns scanner, which studies chart patterns, resistances and supports, has identified this signal:
Support of channel is broken
Type : Bearish
Timeframe : 1 hour
The presence of these Japanese chandelier patterns detected by Central Candlesticks that could impact the current short-term trend were also noted:
Bullish harami
Type : Bullish
Timeframe : 1 hour
Doji
Type : Neutral
Timeframe : 1 hour
| S3 | S2 | S1 | Price | R1 | R2 | |
|---|---|---|---|---|---|---|
| ProTrendLines | 67.96 | 71.16 | 76.29 | 77.32 | 80.95 | 84.80 |
| Change (%) | -12.11% | -7.97% | -1.33% | - | +4.69% | +9.67% |
| Change | -9.36 | -6.16 | -1.03 | - | +3.63 | +7.48 |
| Level | Major | Intermediate | Major | - | Intermediate | Minor |
To determine price objectives, it is also possible to use the pivot points. Here is the price position in relation to pivot points:
| Pivot points | S3 | S2 | S1 | PP | R1 | R2 | R3 |
|---|---|---|---|---|---|---|---|
| Standard | 72.65 | 74.38 | 75.78 | 77.51 | 78.91 | 80.64 | 82.04 |
| Camarilla | 76.32 | 76.61 | 76.89 | 77.18 | 77.47 | 77.75 | 78.04 |
| Woodie | 72.49 | 74.30 | 75.62 | 77.43 | 78.75 | 80.56 | 81.88 |
| Fibonacci | 74.38 | 75.58 | 76.31 | 77.51 | 78.71 | 79.44 | 80.64 |
| Pivot points | S3 | S2 | S1 | PP | R1 | R2 | R3 |
|---|---|---|---|---|---|---|---|
| Standard | 68.67 | 73.04 | 76.06 | 80.43 | 83.45 | 87.82 | 90.84 |
| Camarilla | 77.05 | 77.73 | 78.40 | 79.08 | 79.76 | 80.44 | 81.11 |
| Woodie | 68.00 | 72.70 | 75.39 | 80.09 | 82.78 | 87.48 | 90.17 |
| Fibonacci | 73.04 | 75.86 | 77.61 | 80.43 | 83.25 | 85.00 | 87.82 |
| Pivot points | S3 | S2 | S1 | PP | R1 | R2 | R3 |
|---|---|---|---|---|---|---|---|
| Standard | 22.60 | 31.81 | 49.45 | 58.66 | 76.30 | 85.51 | 103.15 |
| Camarilla | 59.70 | 62.16 | 64.62 | 67.08 | 69.54 | 72.00 | 74.46 |
| Woodie | 26.81 | 33.92 | 53.66 | 60.77 | 80.51 | 87.62 | 107.36 |
| Fibonacci | 31.81 | 42.07 | 48.41 | 58.66 | 68.92 | 75.26 | 85.51 |
Numerical data
The following is the status of technical indicators and moving averages registered at the time this technical analysis was created:
| RSI (14): | 38.53 | |
| MACD (12,26,9): | -0.7700 | |
| Directional Movement: | -17.25 | |
| AROON (14): | -85.71 | |
| DEMA (21): | 77.67 | |
| Parabolic SAR (0,02-0,02-0,2): | 78.33 | |
| Elder Ray (13): | -1.18 | |
| Super Trend (3,10): | 80.84 | |
| Zig ZAG (10): | 76.73 | |
| VORTEX (21): | 0.8200 | |
| Stochastique (14,3,5): | 29.36 | |
| TEMA (21): | 76.56 | |
| Williams %R (14): | -71.99 | |
| Chande Momentum Oscillator (20): | -2.42 | |
| Repulse (5,40,3): | -0.6900 | |
| ROCnROLL: | 2 | |
| TRIX (15,9): | -0.0900 | |
| Courbe Coppock: | 6.81 |
| MA7: | 79.86 | |
| MA20: | 75.44 | |
| MA50: | 63.05 | |
| MA100: | 49.31 | |
| MAexp7: | 77.45 | |
| MAexp20: | 78.49 | |
| MAexp50: | 78.38 | |
| MAexp100: | 76.37 | |
| Price / MA7: | -3.18% | |
| Price / MA20: | +2.49% | |
| Price / MA50: | +22.63% | |
| Price / MA100: | +56.80% | |
| Price / MAexp7: | -0.18% | |
| Price / MAexp20: | -1.50% | |
| Price / MAexp50: | -1.37% | |
| Price / MAexp100: | +1.23% |
About author

Online


Add a comment
Comments
0 comments on the analysis PALANTIR TECHNOLOGIES INC. - 1H