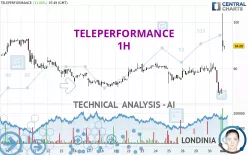
TELEPERFORMANCE - 1H - Technical analysis published on 05/02/2024 (GMT)
- 214
- 0
Click here for a new analysis!
- Timeframe : 1H
- - Analysis generated on
- Status : TARGET REACHED

Summary of the analysis

Additional analysis
Quotes
The TELEPERFORMANCE rating is 95.34 EUR. On the day, this instrument gained +11.54% with the lowest point at 95.00 EUR and the highest point at 101.95 EUR. The deviation from the price is +0.36% for the low point and -6.48% for the high point.The Central Gaps scanner detects the formation of a bullish gap marking the strong presence of buyers against sellers at the opening. This formed a quotation gap.
Opening Gap UP
Type : Bullish
Timeframe : Openning
So that you have an overall view of the price change, here is a table showing the variations over several periods:
Near a new LOW record (5 years)
Type : Bearish
Timeframe : Weekly
New HIGH record (1 month)
Type : Bullish
Timeframe : Weekly
Technical
Technical analysis of this 1H chart of TELEPERFORMANCE indicates that the overall trend is bullish. The signals returned by the moving averages are 78.57% bullish. This bullish trend is reinforced by the strong signals currently being given by short-term moving averages. The Central Indicators market scanner is currently detecting several bullish signals that could impact this trend:
Bullish price crossover with Moving Average 20
Type : Bullish
Timeframe : 1 hour
Bullish price crossover with Moving Average 50
Type : Bullish
Timeframe : 1 hour
Bullish price crossover with Moving Average 100
Type : Bullish
Timeframe : 1 hour
Bullish price crossover with adaptative moving average 20
Type : Bullish
Timeframe : 1 hour
Bullish price crossover with adaptative moving average 50
Type : Bullish
Timeframe : 1 hour
Bullish price crossover with adaptative moving average 100
Type : Bullish
Timeframe : 1 hour
In fact, 11 technical indicators on 18 studied are currently positioned bullish. Caution: the Central Indicators scanner currently detects an excess:
RSI indicator is overbought : over 70
Type : Neutral
Timeframe : 1 hour
CCI indicator is overbought : over 100
Type : Neutral
Timeframe : 1 hour
Pivot points : price is over resistance 2
Type : Neutral
Timeframe : 1 hour
Pivot points : price is over resistance 3
Type : Neutral
Timeframe : Weekly
MACD crosses UP its Moving Average
Type : Bullish
Timeframe : 1 hour
Parabolic SAR indicator bullish reversal
Type : Bullish
Timeframe : 1 hour
Aroon indicator bullish trend
Type : Bullish
Timeframe : 1 hour
Ichimoku : price is over the cloud
Type : Bullish
Timeframe : 1 hour
SuperTrend indicator bullish reversal
Type : Bullish
Timeframe : 1 hour
Momentum indicator is back over 0
Type : Bullish
Timeframe : 1 hour
Williams %R indicator is back over -50
Type : Bullish
Timeframe : 1 hour
The analysis of the price chart with Central Patterns scanners does not return any result.
From the Japanese candlestick perspective, the Central Candlesticks scanner notes the presence of these results that could impact the short-term trend:
White gravestone / inverted hammer
Type : Neutral
Timeframe : 1 hour
Upside gap
Type : Bullish
Timeframe : 1 hour
Doji
Type : Neutral
Timeframe : 1 hour
Long black line
Type : Bearish
Timeframe : 1 hour
| S3 | S2 | S1 | Price | R1 | R2 | R3 | |
|---|---|---|---|---|---|---|---|
| ProTrendLines | 86.01 | 89.13 | 91.27 | 95.34 | 96.56 | 99.10 | 116.47 |
| Change (%) | -9.79% | -6.51% | -4.27% | - | +1.28% | +3.94% | +22.16% |
| Change | -9.33 | -6.21 | -4.07 | - | +1.22 | +3.76 | +21.13 |
| Level | Major | Minor | Intermediate | - | Minor | Major | Intermediate |
To determine price objectives, it is also possible to use the pivot points. Here is the price position in relation to pivot points:
| Pivot points | S3 | S2 | S1 | PP | R1 | R2 | R3 |
|---|---|---|---|---|---|---|---|
| Standard | 75.69 | 79.97 | 82.73 | 87.01 | 89.77 | 94.05 | 96.81 |
| Camarilla | 83.54 | 84.19 | 84.84 | 85.48 | 86.13 | 86.77 | 87.42 |
| Woodie | 74.92 | 79.59 | 81.96 | 86.63 | 89.00 | 93.67 | 96.04 |
| Fibonacci | 79.97 | 82.66 | 84.32 | 87.01 | 89.70 | 91.36 | 94.05 |
| Pivot points | S3 | S2 | S1 | PP | R1 | R2 | R3 |
|---|---|---|---|---|---|---|---|
| Standard | 82.05 | 84.43 | 86.51 | 88.89 | 90.97 | 93.35 | 95.43 |
| Camarilla | 87.37 | 87.78 | 88.19 | 88.60 | 89.01 | 89.42 | 89.83 |
| Woodie | 81.91 | 84.36 | 86.37 | 88.82 | 90.83 | 93.28 | 95.29 |
| Fibonacci | 84.43 | 86.13 | 87.18 | 88.89 | 90.59 | 91.64 | 93.35 |
| Pivot points | S3 | S2 | S1 | PP | R1 | R2 | R3 |
|---|---|---|---|---|---|---|---|
| Standard | 68.67 | 76.47 | 80.97 | 88.77 | 93.27 | 101.07 | 105.57 |
| Camarilla | 82.10 | 83.23 | 84.35 | 85.48 | 86.61 | 87.74 | 88.86 |
| Woodie | 67.03 | 75.65 | 79.33 | 87.95 | 91.63 | 100.25 | 103.93 |
| Fibonacci | 76.47 | 81.17 | 84.07 | 88.77 | 93.47 | 96.37 | 101.07 |
Numerical data
The following is the status of the technical indicators and moving averages at the time of publication of this technical analysis:
| RSI (14): | 69.52 | |
| MACD (12,26,9): | -0.1200 | |
| Directional Movement: | 43.24 | |
| AROON (14): | 14.29 | |
| DEMA (21): | 88.78 | |
| Parabolic SAR (0,02-0,02-0,2): | 84.26 | |
| Elder Ray (13): | 9.58 | |
| Super Trend (3,10): | 90.30 | |
| Zig ZAG (10): | 95.84 | |
| VORTEX (21): | 0.8900 | |
| Stochastique (14,3,5): | 30.66 | |
| TEMA (21): | 88.80 | |
| Williams %R (14): | -34.43 | |
| Chande Momentum Oscillator (20): | 5.76 | |
| Repulse (5,40,3): | -4.2300 | |
| ROCnROLL: | 1 | |
| TRIX (15,9): | -0.0300 | |
| Courbe Coppock: | 2.24 |
| MA7: | 89.69 | |
| MA20: | 89.82 | |
| MA50: | 96.92 | |
| MA100: | 115.73 | |
| MAexp7: | 89.14 | |
| MAexp20: | 88.97 | |
| MAexp50: | 89.09 | |
| MAexp100: | 89.21 | |
| Price / MA7: | +6.30% | |
| Price / MA20: | +6.15% | |
| Price / MA50: | -1.63% | |
| Price / MA100: | -17.62% | |
| Price / MAexp7: | +6.96% | |
| Price / MAexp20: | +7.16% | |
| Price / MAexp50: | +7.02% | |
| Price / MAexp100: | +6.87% |
News
The last news published on TELEPERFORMANCE at the time of the generation of this analysis was as follows:
- Teleperformance Named a General Motors 2023 Supplier of the Year
- Teleperformance joins tech industry leaders, Thorn and All Tech is Human to support strong child safety commitments for generative AI
- Teleperformance named a Leader and Star Performer in Trust and Safety content moderation services by research firm Everest Group
- Teleperformance makes Fortune List of '100 Best Companies to Work For' in U.S. for second consecutive year
- Teleperformance Citizen of the World philanthropy programs benefitted nearly 225,000 vulnerable people in 2023
About author
Online


Add a comment
Comments
0 comments on the analysis TELEPERFORMANCE - 1H