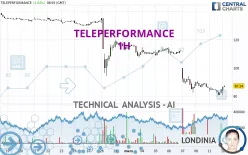
TELEPERFORMANCE - 1H - Technical analysis published on 03/12/2024 (GMT)
- 168
- 0
Click here for a new analysis!
- Timeframe : 1H
- - Analysis generated on
- Status : LEVEL MAINTAINED

Summary of the analysis

Additional analysis
Quotes
TELEPERFORMANCE rating 86.74 EUR. On the day, this instrument gained +2.05% and was between 80.80 EUR and 86.74 EUR. This implies that the price is at +7.35% from its lowest and at 0% from its highest.A study of price movements over other periods shows the following variations:
New LOW record (5 years)
Type : Bearish
Timeframe : Weekly
Near a new LOW record (1 year)
Type : Bearish
Timeframe : Weekly
Near a new LOW record (1st january)
Type : Bearish
Timeframe : Weekly
Near a new LOW record (1 month)
Type : Bearish
Timeframe : Weekly
The Central Volumes scanner detects abnormal volumes on the asset:
Abnormal volumes
Timeframe : 5 days
Technical
Technical analysis of this 1H chart of TELEPERFORMANCE indicates that the overall trend is strongly bearish. 85.71% of the signals given by moving averages are bearish. The slightly bearish signals from short-term moving averages show that the overall trend is slowing down. The Central Indicators market scanner currently does not detect any result that concerns moving averages.
An assessment of technical indicators does not currently provide any relevant information to suggest whether the signal given by the technical indicators is more bullish or bearish.
Central Indicators, the detector scanner for these technical indicators has recently detected several signals:
Price is back over the pivot point
Type : Bullish
Timeframe : 1 hour
Williams %R indicator is back over -50
Type : Bullish
Timeframe : 1 hour
Central Patterns, the market scanner focusing on chart patterns, resistances and supports found this result:
Near resistance of channel
Type : Bearish
Timeframe : 1 hour
The Central Candlesticks scanner which studies Japanese candlesticks did not detect anything.
| S3 | S2 | S1 | Price | R1 | R2 | R3 | |
|---|---|---|---|---|---|---|---|
| ProTrendLines | 12.93 | 63.00 | 82.61 | 86.74 | 94.28 | 99.10 | 108.75 |
| Change (%) | -85.09% | -27.37% | -4.76% | - | +8.69% | +14.25% | +25.37% |
| Change | -73.81 | -23.74 | -4.13 | - | +7.54 | +12.36 | +22.01 |
| Level | Intermediate | Minor | Intermediate | - | Minor | Major | Minor |
Attention could also be paid to pivot points to set price objectives:
| Pivot points | S3 | S2 | S1 | PP | R1 | R2 | R3 |
|---|---|---|---|---|---|---|---|
| Standard | 75.80 | 78.28 | 81.64 | 84.12 | 87.48 | 89.96 | 93.32 |
| Camarilla | 83.39 | 83.93 | 84.47 | 85.00 | 85.54 | 86.07 | 86.61 |
| Woodie | 76.24 | 78.50 | 82.08 | 84.34 | 87.92 | 90.18 | 93.76 |
| Fibonacci | 78.28 | 80.51 | 81.89 | 84.12 | 86.35 | 87.73 | 89.96 |
| Pivot points | S3 | S2 | S1 | PP | R1 | R2 | R3 |
|---|---|---|---|---|---|---|---|
| Standard | 41.83 | 62.13 | 74.06 | 94.36 | 106.29 | 126.59 | 138.52 |
| Camarilla | 77.14 | 80.09 | 83.05 | 86.00 | 88.95 | 91.91 | 94.86 |
| Woodie | 37.66 | 60.04 | 69.89 | 92.27 | 102.12 | 124.50 | 134.35 |
| Fibonacci | 62.13 | 74.44 | 82.05 | 94.36 | 106.67 | 114.28 | 126.59 |
| Pivot points | S3 | S2 | S1 | PP | R1 | R2 | R3 |
|---|---|---|---|---|---|---|---|
| Standard | 39.30 | 66.79 | 90.67 | 118.16 | 142.04 | 169.53 | 193.41 |
| Camarilla | 100.42 | 105.13 | 109.84 | 114.55 | 119.26 | 123.97 | 128.68 |
| Woodie | 37.50 | 65.89 | 88.87 | 117.26 | 140.24 | 168.63 | 191.61 |
| Fibonacci | 66.79 | 86.41 | 98.54 | 118.16 | 137.78 | 149.91 | 169.53 |
Numerical data
The following is the status of the technical indicators and moving averages at the time of publication of this technical analysis:
| RSI (14): | 41.05 | |
| MACD (12,26,9): | -3.7200 | |
| Directional Movement: | -23.88 | |
| AROON (14): | -64.28 | |
| DEMA (21): | 81.48 | |
| Parabolic SAR (0,02-0,02-0,2): | 85.00 | |
| Elder Ray (13): | -1.54 | |
| Super Trend (3,10): | 87.97 | |
| Zig ZAG (10): | 85.80 | |
| VORTEX (21): | 0.8900 | |
| Stochastique (14,3,5): | 43.63 | |
| TEMA (21): | 82.38 | |
| Williams %R (14): | -39.82 | |
| Chande Momentum Oscillator (20): | -2.88 | |
| Repulse (5,40,3): | 7.0700 | |
| ROCnROLL: | -1 | |
| TRIX (15,9): | -0.7000 | |
| Courbe Coppock: | 8.90 |
| MA7: | 97.02 | |
| MA20: | 117.88 | |
| MA50: | 130.49 | |
| MA100: | 127.24 | |
| MAexp7: | 84.38 | |
| MAexp20: | 86.98 | |
| MAexp50: | 95.43 | |
| MAexp100: | 105.62 | |
| Price / MA7: | -10.60% | |
| Price / MA20: | -26.42% | |
| Price / MA50: | -33.53% | |
| Price / MA100: | -31.83% | |
| Price / MAexp7: | +2.80% | |
| Price / MAexp20: | -0.28% | |
| Price / MAexp50: | -9.11% | |
| Price / MAexp100: | -17.88% |
News
Don't forget to follow the news on TELEPERFORMANCE. At the time of publication of this analysis, the latest news was as follows:
- Beko plc announces strategic partnership with global business services leader, Teleperformance
- Teleperformance launches digital services arm TP Infinity in the U.S. to help clients build future-ready, efficient and scalable operations
- Teleperformance awarded Frost & Sullivan's 'Company of the Year' for best practices in agent engagement
- Teleperformance achieves AWS Well-Architected Partner status
- Teleperformance achieves enterprise-wide corporate social responsibility certification from Verego for 10th consecutive year
About author
Online


Add a comment
Comments
0 comments on the analysis TELEPERFORMANCE - 1H