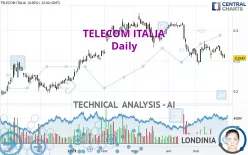
TELECOM ITALIA - Daily - Technical analysis published on 05/30/2023 (GMT)
- 204
- 0
Click here for a new analysis!
- Timeframe : Daily
- - Analysis generated on
- Status : INVALID

Summary of the analysis

Additional analysis
Quotes
The TELECOM ITALIA rating is 0.2569 EUR. The price has increased by +0.86% since the last closing with the lowest point at 0.2550 EUR and the highest point at 0.2584 EUR. The deviation from the price is +0.75% for the low point and -0.58% for the high point.The Central Gaps scanner detects a bullish opening. A small advantage for buyers in the very short term.
Bullish opening
Type : Bullish
Timeframe : Openning
So that you have an overall view of the price change, here is a table showing the variations over several periods:
Near a new LOW record (1 month)
Type : Bearish
Timeframe : Weekly
Technical
A technical analysis in Daily of this TELECOM ITALIA chart shows a bearish trend. 78.57% of the signals given by moving averages are bearish. This bearish trend is supported by the strong bearish signals given by short-term moving averages. There is no crossing of moving average by the price or crossing of moving averages between themselves.
The technical indicators are generally neutral. They do not provide relevant information on the direction of future price movements.
Caution: the Central Indicators scanner currently detects an excess:
RSI indicator: bullish divergence
Type : Bullish
Timeframe : Daily
Williams %R indicator is oversold : under -80
Type : Neutral
Timeframe : Daily
Central Patterns, the market scanner focusing on chart patterns, resistances and supports found these results:
Near horizontal resistance
Type : Bearish
Timeframe : Daily
Near support of channel
Type : Bullish
Timeframe : Daily
Near support of triangle
Type : Bullish
Timeframe : Daily
For a small rebound in the very short term, the Central Candlesticks scanner currently notes the presence of this bullish pattern in Japanese candlesticks:
Bullish harami
Type : Bullish
Timeframe : Daily
| S3 | S2 | S1 | Price | R1 | R2 | R3 | |
|---|---|---|---|---|---|---|---|
| ProTrendLines | 0.2021 | 0.2253 | 0.2369 | 0.2569 | 0.2623 | 0.2776 | 0.2950 |
| Change (%) | -21.33% | -12.30% | -7.79% | - | +2.10% | +8.06% | +14.83% |
| Change | -0.0548 | -0.0316 | -0.0200 | - | +0.0054 | +0.0207 | +0.0381 |
| Level | Intermediate | Minor | Major | - | Major | Major | Minor |
To determine price objectives, it is also possible to use the pivot points. Here is the price position in relation to pivot points:
| Pivot points | S3 | S2 | S1 | PP | R1 | R2 | R3 |
|---|---|---|---|---|---|---|---|
| Standard | 0.2451 | 0.2499 | 0.2523 | 0.2571 | 0.2595 | 0.2643 | 0.2667 |
| Camarilla | 0.2527 | 0.2534 | 0.2540 | 0.2547 | 0.2554 | 0.2560 | 0.2567 |
| Woodie | 0.2439 | 0.2493 | 0.2511 | 0.2565 | 0.2583 | 0.2637 | 0.2655 |
| Fibonacci | 0.2499 | 0.2527 | 0.2544 | 0.2571 | 0.2599 | 0.2616 | 0.2643 |
| Pivot points | S3 | S2 | S1 | PP | R1 | R2 | R3 |
|---|---|---|---|---|---|---|---|
| Standard | 0.2291 | 0.2418 | 0.2502 | 0.2629 | 0.2713 | 0.2840 | 0.2924 |
| Camarilla | 0.2527 | 0.2546 | 0.2566 | 0.2585 | 0.2604 | 0.2624 | 0.2643 |
| Woodie | 0.2269 | 0.2407 | 0.2480 | 0.2618 | 0.2691 | 0.2829 | 0.2902 |
| Fibonacci | 0.2418 | 0.2499 | 0.2549 | 0.2629 | 0.2710 | 0.2760 | 0.2840 |
| Pivot points | S3 | S2 | S1 | PP | R1 | R2 | R3 |
|---|---|---|---|---|---|---|---|
| Standard | 0.1851 | 0.2202 | 0.2435 | 0.2786 | 0.3019 | 0.3370 | 0.3603 |
| Camarilla | 0.2508 | 0.2562 | 0.2616 | 0.2669 | 0.2723 | 0.2776 | 0.2830 |
| Woodie | 0.1793 | 0.2173 | 0.2377 | 0.2757 | 0.2961 | 0.3341 | 0.3545 |
| Fibonacci | 0.2202 | 0.2425 | 0.2563 | 0.2786 | 0.3009 | 0.3147 | 0.3370 |
Numerical data
The following is the status of technical indicators and moving averages registered at the time this technical analysis was created:
| RSI (14): | 40.47 | |
| MACD (12,26,9): | -0.0054 | |
| Directional Movement: | -13.1521 | |
| AROON (14): | -28.5714 | |
| DEMA (21): | 0.2590 | |
| Parabolic SAR (0,02-0,02-0,2): | 0.2798 | |
| Elder Ray (13): | -0.0071 | |
| Super Trend (3,10): | 0.2480 | |
| Zig ZAG (10): | 0.2575 | |
| VORTEX (21): | 0.9421 | |
| Stochastique (14,3,5): | 12.39 | |
| TEMA (21): | 0.2590 | |
| Williams %R (14): | -82.20 | |
| Chande Momentum Oscillator (20): | -0.0152 | |
| Repulse (5,40,3): | -2.5009 | |
| ROCnROLL: | 2 | |
| TRIX (15,9): | -0.2867 | |
| Courbe Coppock: | 3.15 |
| MA7: | 0.2636 | |
| MA20: | 0.2649 | |
| MA50: | 0.2803 | |
| MA100: | 0.2826 | |
| MAexp7: | 0.2611 | |
| MAexp20: | 0.2665 | |
| MAexp50: | 0.2746 | |
| MAexp100: | 0.2720 | |
| Price / MA7: | -2.54% | |
| Price / MA20: | -3.02% | |
| Price / MA50: | -8.35% | |
| Price / MA100: | -9.09% | |
| Price / MAexp7: | -1.61% | |
| Price / MAexp20: | -3.60% | |
| Price / MAexp50: | -6.45% | |
| Price / MAexp100: | -5.55% |
News
The last news published on TELECOM ITALIA at the time of the generation of this analysis was as follows:
-
 Telecom Italia
-
Telecom Italia
-
Telecom Italia Chairman Says No Contact With Trujillo
-
Latest Business News: Telecom Italia Eyes Network Deal With Regulator by Early 2014
About author
Online


Add a comment
Comments
0 comments on the analysis TELECOM ITALIA - Daily