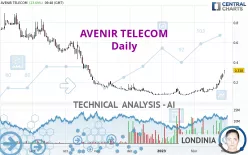
AVENIR TELECOM - Daily - Technical analysis published on 03/01/2023 (GMT)
- 178
- 0
Click here for a new analysis!
- Timeframe : Daily
- - Analysis generated on
- Status : TARGET REACHED

Summary of the analysis

Additional analysis
Quotes
The AVENIR TELECOM price is 0.3180 EUR. On the day, this instrument gained +23.69% and was traded between 0.2880 EUR and 0.3200 EUR over the period. The price is currently at +10.42% from its lowest and -0.63% from its highest.The Central Gaps scanner detects the formation of a bullish gap marking the strong presence of buyers against sellers at the opening. This formed a quotation gap.
Opening Gap UP
Type : Bullish
Timeframe : Openning
Here is a more detailed summary of the historical variations registered by AVENIR TELECOM:
New HIGH record (1st january)
Type : Bullish
Timeframe : Weekly
New HIGH record (1 month)
Type : Bullish
Timeframe : Weekly
The Central Volumes scanner notes the presence of abnormal volumes:
Abnormal volumes
Timeframe : 5 days
Abnormal volumes
Timeframe : 20 days
Abnormal volumes
Timeframe : 50 days
Technical
A technical analysis in Daily of this AVENIR TELECOM chart shows a bullish trend. 67.86% of the signals given by moving averages are bullish. The overall trend is reinforced by the strong bullish signals from short-term moving averages. There is no crossing of moving average by the price or crossing of moving averages between themselves.
In fact, according to the parameters integrated into the Central Analyzer system, 17 technical indicators out of 18 analysed are currently bullish. But beware of excesses. The Central Indicators scanner currently detects this:
RSI indicator is overbought : over 80
Type : Neutral
Timeframe : Daily
CCI indicator is overbought : over 100
Type : Neutral
Timeframe : Daily
Williams %R indicator is overbought : over -20
Type : Neutral
Timeframe : Daily
Pivot points : price is over resistance 2
Type : Neutral
Timeframe : Daily
Pivot points : price is over resistance 2
Type : Neutral
Timeframe : Weekly
Central Patterns, the scanner specializing in chart patterns, did not identify any signals.
The Central Candlesticks scanner, specialised in Japanese candlesticks, did not identify any signals.
| S1 | Price | R1 | R2 | R3 | |
|---|---|---|---|---|---|
| ProTrendLines | 0.1336 | 0.3180 | 0.7440 | 1.1344 | 1.3920 |
| Change (%) | -57.99% | - | +133.96% | +256.73% | +337.74% |
| Change | -0.1844 | - | +0.4260 | +0.8164 | +1.0740 |
| Level | Major | - | Major | Intermediate | Minor |
Pivot points can also be used to set your price objectives. Here is the price situation in relation to pivot points:
| Pivot points | S3 | S2 | S1 | PP | R1 | R2 | R3 |
|---|---|---|---|---|---|---|---|
| Standard | 0.1856 | 0.2130 | 0.2351 | 0.2625 | 0.2846 | 0.3120 | 0.3341 |
| Camarilla | 0.2435 | 0.2480 | 0.2526 | 0.2571 | 0.2616 | 0.2662 | 0.2707 |
| Woodie | 0.1829 | 0.2117 | 0.2324 | 0.2612 | 0.2819 | 0.3107 | 0.3314 |
| Fibonacci | 0.2130 | 0.2319 | 0.2436 | 0.2625 | 0.2814 | 0.2931 | 0.3120 |
| Pivot points | S3 | S2 | S1 | PP | R1 | R2 | R3 |
|---|---|---|---|---|---|---|---|
| Standard | 0.0566 | 0.0923 | 0.1534 | 0.1891 | 0.2502 | 0.2859 | 0.3470 |
| Camarilla | 0.1879 | 0.1968 | 0.2056 | 0.2145 | 0.2234 | 0.2323 | 0.2411 |
| Woodie | 0.0693 | 0.0987 | 0.1661 | 0.1955 | 0.2629 | 0.2923 | 0.3597 |
| Fibonacci | 0.0923 | 0.1293 | 0.1521 | 0.1891 | 0.2261 | 0.2489 | 0.2859 |
| Pivot points | S3 | S2 | S1 | PP | R1 | R2 | R3 |
|---|---|---|---|---|---|---|---|
| Standard | -0.0604 | 0.0162 | 0.1367 | 0.2133 | 0.3338 | 0.4104 | 0.5309 |
| Camarilla | 0.2029 | 0.2210 | 0.2390 | 0.2571 | 0.2752 | 0.2932 | 0.3113 |
| Woodie | -0.0386 | 0.0272 | 0.1586 | 0.2243 | 0.3557 | 0.4214 | 0.5528 |
| Fibonacci | 0.0162 | 0.0915 | 0.1380 | 0.2133 | 0.2886 | 0.3351 | 0.4104 |
Numerical data
The following is the status of technical indicators and moving averages registered at the time this technical analysis was created:
| RSI (14): | 83.84 | |
| MACD (12,26,9): | 0.0419 | |
| Directional Movement: | 43.8804 | |
| AROON (14): | 92.8571 | |
| DEMA (21): | 0.2191 | |
| Parabolic SAR (0,02-0,02-0,2): | 0.1940 | |
| Elder Ray (13): | 0.1071 | |
| Super Trend (3,10): | 0.2052 | |
| Zig ZAG (10): | 0.3140 | |
| VORTEX (21): | 1.2654 | |
| Stochastique (14,3,5): | 91.12 | |
| TEMA (21): | 0.2545 | |
| Williams %R (14): | -2.67 | |
| Chande Momentum Oscillator (20): | 0.2076 | |
| Repulse (5,40,3): | 10.7459 | |
| ROCnROLL: | 1 | |
| TRIX (15,9): | 3.1200 | |
| Courbe Coppock: | 197.11 |
| MA7: | 0.2212 | |
| MA20: | 0.1548 | |
| MA50: | 0.1123 | |
| MA100: | 0.1554 | |
| MAexp7: | 0.2345 | |
| MAexp20: | 0.1726 | |
| MAexp50: | 0.1485 | |
| MAexp100: | 0.2195 | |
| Price / MA7: | +43.76% | |
| Price / MA20: | +105.43% | |
| Price / MA50: | +183.17% | |
| Price / MA100: | +104.63% | |
| Price / MAexp7: | +35.61% | |
| Price / MAexp20: | +84.24% | |
| Price / MAexp50: | +114.14% | |
| Price / MAexp100: | +44.87% |
About author

Online


Add a comment
Comments
0 comments on the analysis AVENIR TELECOM - Daily