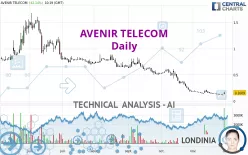
AVENIR TELECOM - Daily - Technical analysis published on 11/30/2022 (GMT)
- 147
- 0
Click here for a new analysis!
- Timeframe : Daily
- - Analysis generated on
- Status : TARGET REACHED

Summary of the analysis

Additional analysis
Quotes
AVENIR TELECOM rating 0.1609 EUR. On the day, this instrument gained +42.14% and was between 0.1320 EUR and 0.1800 EUR. This implies that the price is at +21.89% from its lowest and at -10.61% from its highest.The Central Gaps scanner detects the formation of a bullish gap marking the strong presence of buyers against sellers at the opening. This formed a quotation gap.
Opening Gap UP
Type : Bullish
Timeframe : Openning
A study of price movements over other periods shows the following variations:
Abnormal volumes
Timeframe : 5 days
Technical
Technical analysis of this Daily chart of AVENIR TELECOM indicates that the overall trend is strongly bearish. The signals given by moving averages are 85.71% bearish. This strongly bearish trend seems to be slowing down given the slightly bearish signals being given by short-term moving averages. The Central Indicators market scanner is currently detecting several bullish signals that could impact this trend:
Bullish price crossover with Moving Average 20
Type : Bullish
Timeframe : Daily
Bullish price crossover with adaptative moving average 20
Type : Bullish
Timeframe : Daily
Bullish price crossover with adaptative moving average 50
Type : Bullish
Timeframe : Daily
In fact, Central Analyzer took into account 18 technical indicators and the result was as follows: 8 are bullish, 6 are neutral and 4 are bearish. Caution: the Central Indicators scanner currently detects an excess:
RSI indicator: bullish divergence
Type : Bullish
Timeframe : Daily
Pivot points : price is over resistance 1
Type : Neutral
Timeframe : Weekly
Pivot points : price is over resistance 3
Type : Neutral
Timeframe : Daily
Parabolic SAR indicator bullish reversal
Type : Bullish
Timeframe : Daily
Williams %R indicator is back over -50
Type : Bullish
Timeframe : Daily
The analysis of the price chart with Central Patterns scanners does not return any result.
The Central Candlesticks scanner, specialised in Japanese candlesticks, did not identify any signals.
| Price | R1 | R2 | R3 | |
|---|---|---|---|---|
| ProTrendLines | 0.1609 | 0.5120 | 0.8533 | 1.1344 |
| Change (%) | - | +218.21% | +430.33% | +605.03% |
| Change | - | +0.3511 | +0.6924 | +0.9735 |
| Level | - | Minor | Intermediate | Minor |
To determine price objectives, it is also possible to use the pivot points. Here is the price position in relation to pivot points:
| Pivot points | S3 | S2 | S1 | PP | R1 | R2 | R3 |
|---|---|---|---|---|---|---|---|
| Standard | 0.1016 | 0.1071 | 0.1101 | 0.1156 | 0.1186 | 0.1241 | 0.1271 |
| Camarilla | 0.1109 | 0.1116 | 0.1124 | 0.1132 | 0.1140 | 0.1148 | 0.1155 |
| Woodie | 0.1005 | 0.1065 | 0.1090 | 0.1150 | 0.1175 | 0.1235 | 0.1260 |
| Fibonacci | 0.1071 | 0.1103 | 0.1123 | 0.1156 | 0.1188 | 0.1208 | 0.1241 |
| Pivot points | S3 | S2 | S1 | PP | R1 | R2 | R3 |
|---|---|---|---|---|---|---|---|
| Standard | 0.0748 | 0.0974 | 0.1132 | 0.1358 | 0.1516 | 0.1742 | 0.1900 |
| Camarilla | 0.1184 | 0.1220 | 0.1255 | 0.1290 | 0.1325 | 0.1360 | 0.1396 |
| Woodie | 0.0714 | 0.0957 | 0.1098 | 0.1341 | 0.1482 | 0.1725 | 0.1866 |
| Fibonacci | 0.0974 | 0.1121 | 0.1211 | 0.1358 | 0.1505 | 0.1595 | 0.1742 |
| Pivot points | S3 | S2 | S1 | PP | R1 | R2 | R3 |
|---|---|---|---|---|---|---|---|
| Standard | -0.4091 | -0.1170 | 0.0319 | 0.3240 | 0.4729 | 0.7650 | 0.9139 |
| Camarilla | 0.0596 | 0.1001 | 0.1405 | 0.1809 | 0.2213 | 0.2618 | 0.3022 |
| Woodie | -0.4806 | -0.1528 | -0.0396 | 0.2882 | 0.4014 | 0.7292 | 0.8424 |
| Fibonacci | -0.1170 | 0.0514 | 0.1555 | 0.3240 | 0.4924 | 0.5965 | 0.7650 |
Numerical data
The following is the status of the technical indicators and moving averages at the time of publication of this technical analysis:
| RSI (14): | 39.01 | |
| MACD (12,26,9): | -0.0509 | |
| Directional Movement: | 2.6443 | |
| AROON (14): | -71.4286 | |
| DEMA (21): | 0.0922 | |
| Parabolic SAR (0,02-0,02-0,2): | 0.1120 | |
| Elder Ray (13): | 0.0100 | |
| Super Trend (3,10): | 0.1844 | |
| Zig ZAG (10): | 0.1585 | |
| VORTEX (21): | 0.8661 | |
| Stochastique (14,3,5): | 20.10 | |
| TEMA (21): | 0.1155 | |
| Williams %R (14): | -49.69 | |
| Chande Momentum Oscillator (20): | -0.0187 | |
| Repulse (5,40,3): | 4.4039 | |
| ROCnROLL: | -1 | |
| TRIX (15,9): | -3.4629 | |
| Courbe Coppock: | 38.15 |
| MA7: | 0.1313 | |
| MA20: | 0.1505 | |
| MA50: | 0.3185 | |
| MA100: | 0.5208 | |
| MAexp7: | 0.1361 | |
| MAexp20: | 0.1692 | |
| MAexp50: | 0.3019 | |
| MAexp100: | 0.5017 | |
| Price / MA7: | +22.54% | |
| Price / MA20: | +6.91% | |
| Price / MA50: | -49.48% | |
| Price / MA100: | -69.11% | |
| Price / MAexp7: | +18.22% | |
| Price / MAexp20: | -4.91% | |
| Price / MAexp50: | -46.70% | |
| Price / MAexp100: | -67.93% |
About author
Online


Add a comment
Comments
0 comments on the analysis AVENIR TELECOM - Daily