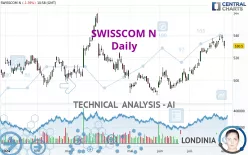
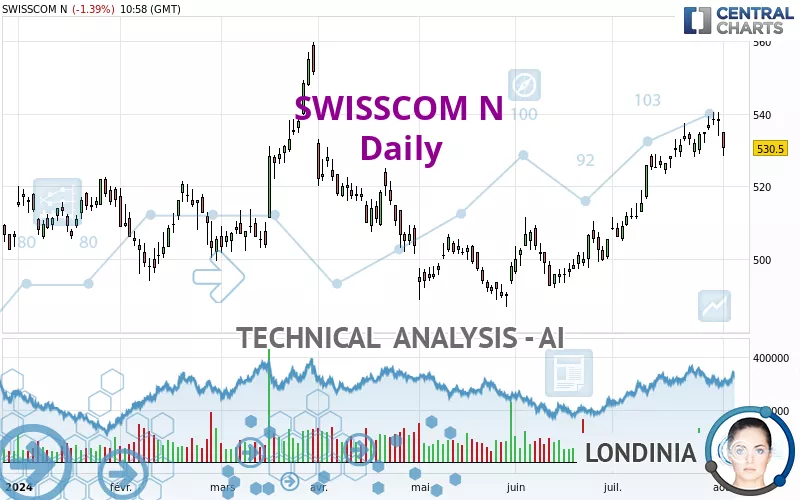
SWISSCOM N - Daily - Technical analysis published on 09/02/2024 (GMT)
- 151
- 0
Click here for a new analysis!
- Timeframe : Daily
- - Analysis generated on
- Status : TARGET REACHED
Summary of the analysis

Additional analysis
Quotes
SWISSCOM N rating 543.0 CHF. The price has increased by +1.21% since the last closing with the lowest point at 537.5 CHF and the highest point at 543.0 CHF. The deviation from the price is +1.02% for the low point and 0% for the high point.The Central Gaps scanner detects a bullish opening marking the presence of buyers ahead of sellers at the opening but not sufficiently marked to allow the price to register a quotation gap.
Bullish opening
Type : Bullish
Timeframe : Openning
Here is a more detailed summary of the historical variations registered by SWISSCOM N:
Near a new HIGH record (1 year)
Type : Bullish
Timeframe : Weekly
Near a new HIGH record (1st january)
Type : Bullish
Timeframe : Weekly
New HIGH record (1 month)
Type : Bullish
Timeframe : Weekly
Technical
Technical analysis of SWISSCOM N in Daily shows a strongly overall bullish trend. 92.86% of the signals given by moving averages are bullish. The overall trend is supported by the strong bullish signals from short-term moving averages. The Central Indicators scanner detects a bullish signal on moving averages that could impact this trend:
Bullish trend reversal : Moving Average 20
Type : Bullish
Timeframe : Daily
The probability of a further increase is high given the direction of the technical indicators.
Caution: the Central Indicators scanner currently detects an excess:
CCI indicator is overbought : over 100
Type : Neutral
Timeframe : Daily
Williams %R indicator is overbought : over -20
Type : Neutral
Timeframe : Daily
Pivot points : price is over resistance 2
Type : Neutral
Timeframe : Weekly
Pivot points : price is over resistance 3
Type : Neutral
Timeframe : Daily
Central Patterns, the market scanner focusing on chart patterns, resistances and supports found these results:
Near resistance of channel
Type : Bearish
Timeframe : Daily
Horizontal resistance is broken
Type : Bullish
Timeframe : Daily
The Central Candlesticks scanner, specialised in Japanese candlesticks, did not identify any signals.
| S3 | S2 | S1 | Price | R1 | R2 | R3 | |
|---|---|---|---|---|---|---|---|
| ProTrendLines | 525.8 | 532.5 | 538.5 | 543.0 | 553.7 | 586.6 | 619.4 |
| Change (%) | -3.17% | -1.93% | -0.83% | - | +1.97% | +8.03% | +14.07% |
| Change | -17.2 | -10.5 | -4.5 | - | +10.7 | +43.6 | +76.4 |
| Level | Minor | Intermediate | Intermediate | - | Major | Intermediate | Major |
Attention could also be paid to pivot points to set price objectives:
| Pivot points | S3 | S2 | S1 | PP | R1 | R2 | R3 |
|---|---|---|---|---|---|---|---|
| Standard | 530.7 | 532.8 | 534.7 | 536.8 | 538.7 | 540.8 | 542.7 |
| Camarilla | 535.4 | 535.8 | 536.1 | 536.5 | 536.9 | 537.2 | 537.6 |
| Woodie | 530.5 | 532.8 | 534.5 | 536.8 | 538.5 | 540.8 | 542.5 |
| Fibonacci | 532.8 | 534.4 | 535.3 | 536.8 | 538.4 | 539.3 | 540.8 |
| Pivot points | S3 | S2 | S1 | PP | R1 | R2 | R3 |
|---|---|---|---|---|---|---|---|
| Standard | 528.2 | 530.8 | 533.7 | 536.3 | 539.2 | 541.8 | 544.7 |
| Camarilla | 535.0 | 535.5 | 536.0 | 536.5 | 537.0 | 537.5 | 538.0 |
| Woodie | 528.3 | 530.9 | 533.8 | 536.4 | 539.3 | 541.9 | 544.8 |
| Fibonacci | 530.8 | 532.9 | 534.2 | 536.3 | 538.4 | 539.7 | 541.8 |
| Pivot points | S3 | S2 | S1 | PP | R1 | R2 | R3 |
|---|---|---|---|---|---|---|---|
| Standard | 494.0 | 503.5 | 520.0 | 529.5 | 546.0 | 555.5 | 572.0 |
| Camarilla | 529.4 | 531.7 | 534.1 | 536.5 | 538.9 | 541.3 | 543.7 |
| Woodie | 497.5 | 505.3 | 523.5 | 531.3 | 549.5 | 557.3 | 575.5 |
| Fibonacci | 503.5 | 513.4 | 519.6 | 529.5 | 539.4 | 545.6 | 555.5 |
Numerical data
The following is the status of technical indicators and moving averages registered at the time this technical analysis was created:
| RSI (14): | 66.30 | |
| MACD (12,26,9): | 3.8000 | |
| Directional Movement: | 13.0 | |
| AROON (14): | 100.0 | |
| DEMA (21): | 537.4 | |
| Parabolic SAR (0,02-0,02-0,2): | 524.7 | |
| Elder Ray (13): | 5.9 | |
| Super Trend (3,10): | 526.1 | |
| Zig ZAG (10): | 542.5 | |
| VORTEX (21): | 1.0000 | |
| Stochastique (14,3,5): | 84.30 | |
| TEMA (21): | 537.7 | |
| Williams %R (14): | -3.10 | |
| Chande Momentum Oscillator (20): | 14.0 | |
| Repulse (5,40,3): | 0.7000 | |
| ROCnROLL: | 1 | |
| TRIX (15,9): | 0.1000 | |
| Courbe Coppock: | 4.30 |
| MA7: | 536.8 | |
| MA20: | 530.2 | |
| MA50: | 524.9 | |
| MA100: | 513.7 | |
| MAexp7: | 536.8 | |
| MAexp20: | 532.5 | |
| MAexp50: | 525.5 | |
| MAexp100: | 520.2 | |
| Price / MA7: | +1.15% | |
| Price / MA20: | +2.41% | |
| Price / MA50: | +3.45% | |
| Price / MA100: | +5.70% | |
| Price / MAexp7: | +1.15% | |
| Price / MAexp20: | +1.97% | |
| Price / MAexp50: | +3.33% | |
| Price / MAexp100: | +4.38% |
News
Don't forget to follow the news on SWISSCOM N. At the time of publication of this analysis, the latest news was as follows:
- EchoStar Mobile and Actility Expand LoRaWAN IoT Coverage for Swisscom
- EchoStar Mobile and Actility Expand LoRaWAN IoT Coverage for Swisscom
- Neo Medical closes Swisscom Ventures-lead USD $20.6M financing round
- Swisscom Joins FreeMove
- Artificial Solutions and Swisscom Announce Partnership
About author
Online


Add a comment
Comments
0 comments on the analysis SWISSCOM N - Daily