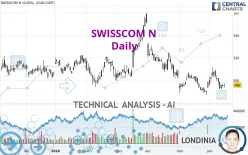
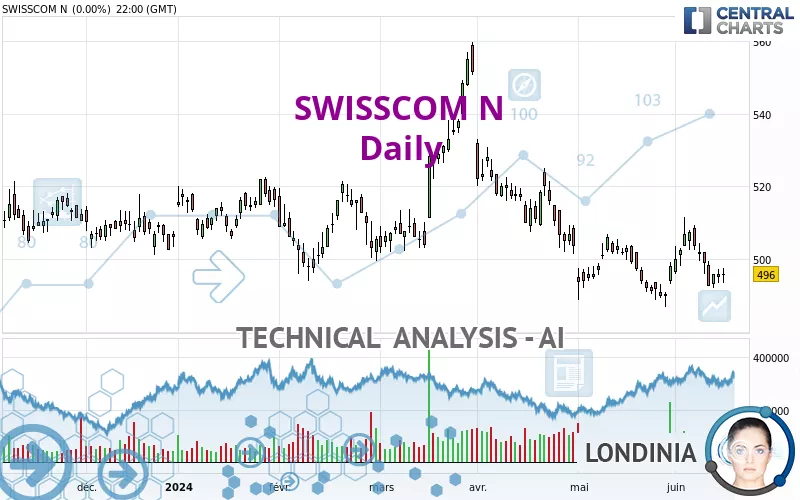
SWISSCOM N - Daily - Technical analysis published on 06/18/2024 (GMT)
- 156
- 0
Click here for a new analysis!
- Timeframe : Daily
- - Analysis generated on
- Status : INVALID
Summary of the analysis

Additional analysis
Quotes
The SWISSCOM N price is 495.4 CHF. The price is lower by -0.12% since the last closing with the lowest point at 495.2 CHF and the highest point at 498.2 CHF. The deviation from the price is +0.04% for the low point and -0.56% for the high point.The Central Gaps scanner detects a bullish opening marking the presence of buyers ahead of sellers at the opening but not sufficiently marked to allow the price to register a quotation gap.
Bullish opening
Type : Bullish
Timeframe : Openning
A study of price movements over other periods shows the following variations:
Near a new LOW record (1 year)
Type : Bearish
Timeframe : Weekly
Near a new LOW record (1st january)
Type : Bearish
Timeframe : Weekly
Near a new HIGH record (1 month)
Type : Bullish
Timeframe : Weekly
Technical
Technical analysis of SWISSCOM N in Daily shows a overall strongly bearish trend. 92.86% of the signals given by moving averages are bearish. This strongly bearish trend is supported by the strong bearish signals given by short-term moving averages. The Central Indicators scanner does not detect any result on moving averages that would impact this trend.
In fact, only 7 technical indicators out of 18 studied are currently positioned bearish. Central Indicators, the detector scanner for these technical indicators has recently detected several signals:
Price is back under the pivot point
Type : Bearish
Timeframe : Daily
Momentum indicator is back under 0
Type : Bearish
Timeframe : Daily
Central Patterns, the scanner specializing in chart patterns, did not identify any signals.
The Central Candlesticks scanner, specialised in Japanese candlesticks, did not identify any signals.
| S3 | S2 | S1 | Price | R1 | R2 | R3 | |
|---|---|---|---|---|---|---|---|
| ProTrendLines | 357.3 | 466.0 | 489.8 | 495.4 | 497.4 | 502.7 | 523.0 |
| Change (%) | -27.88% | -5.93% | -1.13% | - | +0.40% | +1.47% | +5.57% |
| Change | -138.1 | -29.4 | -5.6 | - | +2.0 | +7.3 | +27.6 |
| Level | Minor | Major | Intermediate | - | Major | Major | Intermediate |
Pivot points can also be used to set your price objectives. Here is the price situation in relation to pivot points:
| Pivot points | S3 | S2 | S1 | PP | R1 | R2 | R3 |
|---|---|---|---|---|---|---|---|
| Standard | 489.5 | 491.5 | 493.7 | 495.7 | 497.9 | 499.9 | 502.1 |
| Camarilla | 494.9 | 495.2 | 495.6 | 496.0 | 496.4 | 496.8 | 497.2 |
| Woodie | 489.7 | 491.6 | 493.9 | 495.8 | 498.1 | 500.0 | 502.3 |
| Fibonacci | 491.5 | 493.1 | 494.1 | 495.7 | 497.3 | 498.3 | 499.9 |
| Pivot points | S3 | S2 | S1 | PP | R1 | R2 | R3 |
|---|---|---|---|---|---|---|---|
| Standard | 478.0 | 485.0 | 490.5 | 497.5 | 503.0 | 510.0 | 515.5 |
| Camarilla | 492.6 | 493.7 | 494.9 | 496.0 | 497.2 | 498.3 | 499.4 |
| Woodie | 477.3 | 484.6 | 489.8 | 497.1 | 502.3 | 509.6 | 514.8 |
| Fibonacci | 485.0 | 489.8 | 492.7 | 497.5 | 502.3 | 505.2 | 510.0 |
| Pivot points | S3 | S2 | S1 | PP | R1 | R2 | R3 |
|---|---|---|---|---|---|---|---|
| Standard | 467.5 | 477.1 | 487.7 | 497.3 | 507.9 | 517.5 | 528.1 |
| Camarilla | 492.7 | 494.5 | 496.4 | 498.2 | 500.1 | 501.9 | 503.8 |
| Woodie | 467.9 | 477.4 | 488.1 | 497.6 | 508.3 | 517.8 | 528.5 |
| Fibonacci | 477.1 | 484.9 | 489.6 | 497.3 | 505.1 | 509.8 | 517.5 |
Numerical data
The following is the status of technical indicators and moving averages registered at the time this technical analysis was created:
| RSI (14): | 43.80 | |
| MACD (12,26,9): | -1.8000 | |
| Directional Movement: | -0.5 | |
| AROON (14): | 28.6 | |
| DEMA (21): | 495.8 | |
| Parabolic SAR (0,02-0,02-0,2): | 510.4 | |
| Elder Ray (13): | -0.8 | |
| Super Trend (3,10): | 490.2 | |
| Zig ZAG (10): | 495.6 | |
| VORTEX (21): | 0.9000 | |
| Stochastique (14,3,5): | 36.70 | |
| TEMA (21): | 496.9 | |
| Williams %R (14): | -65.20 | |
| Chande Momentum Oscillator (20): | -2.8 | |
| Repulse (5,40,3): | -0.6000 | |
| ROCnROLL: | 2 | |
| TRIX (15,9): | -0.1000 | |
| Courbe Coppock: | 1.30 |
| MA7: | 496.7 | |
| MA20: | 497.1 | |
| MA50: | 503.8 | |
| MA100: | 509.7 | |
| MAexp7: | 496.9 | |
| MAexp20: | 498.5 | |
| MAexp50: | 503.1 | |
| MAexp100: | 508.4 | |
| Price / MA7: | -0.26% | |
| Price / MA20: | -0.34% | |
| Price / MA50: | -1.67% | |
| Price / MA100: | -2.81% | |
| Price / MAexp7: | -0.30% | |
| Price / MAexp20: | -0.62% | |
| Price / MAexp50: | -1.53% | |
| Price / MAexp100: | -2.56% |
News
Don't forget to follow the news on SWISSCOM N. At the time of publication of this analysis, the latest news was as follows:
- Neo Medical closes Swisscom Ventures-lead USD $20.6M financing round
- Swisscom Joins FreeMove
- Artificial Solutions and Swisscom Announce Partnership
- Artificial Solutions and Swisscom Announce Partnership
- Artificial Solutions and Swisscom Announce Partnership
About author
Online


Add a comment
Comments
0 comments on the analysis SWISSCOM N - Daily