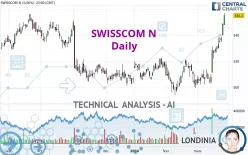
SWISSCOM N - Daily - Technical analysis published on 03/28/2024 (GMT)
- 120
- 0
Click here for a new analysis!
- Timeframe : Daily
- - Analysis generated on
- Status : INVALID

Summary of the analysis

Additional analysis
Quotes
The SWISSCOM N price is 552.6 CHF. The price is lower by -0.47% since the last closing with the lowest point at 552.2 CHF and the highest point at 559.8 CHF. The deviation from the price is +0.07% for the low point and -1.29% for the high point.The Central Gaps scanner detects the formation of a bullish gap marking the strong presence of buyers against sellers at the opening. This formed a quotation gap.
Opening Gap UP
Type : Bullish
Timeframe : Openning
A study of price movements over other periods shows the following variations:
New HIGH record (1st january)
Type : Bullish
Timeframe : Weekly
New HIGH record (1 month)
Type : Bullish
Timeframe : Weekly
Technical
A technical analysis in Daily of this SWISSCOM N chart shows a strongly bullish trend. The signals given by the moving averages are 89.29% bullish. This strong bullish trend is confirmed by the strong signals currently being given by short-term moving averages. The Central Indicators scanner detects a bullish signal on moving averages that could impact this trend:
Bullish trend reversal : Moving Average 100
Type : Bullish
Timeframe : Daily
Technical indicators are strongly bullish, suggesting that the price increase should continue.
Caution: the Central Indicators scanner currently detects an excess:
CCI indicator is overbought : over 100
Type : Neutral
Timeframe : Daily
Williams %R indicator is overbought : over -20
Type : Neutral
Timeframe : Daily
Pivot points : price is over resistance 2
Type : Neutral
Timeframe : Weekly
The Central Patterns scanner, which studies chart patterns, resistances and supports, has identified these signals:
Near horizontal resistance
Type : Bearish
Timeframe : Daily
Resistance of channel is broken
Type : Bullish
Timeframe : Daily
The Central Candlesticks scanner which studies Japanese candlesticks did not detect anything.
| S3 | S2 | S1 | Price | R1 | R2 | R3 | |
|---|---|---|---|---|---|---|---|
| ProTrendLines | 502.7 | 523.0 | 536.4 | 552.6 | 553.1 | 564.0 | 586.6 |
| Change (%) | -9.03% | -5.36% | -2.93% | - | +0.09% | +2.06% | +6.15% |
| Change | -49.9 | -29.6 | -16.2 | - | +0.5 | +11.4 | +34.0 |
| Level | Major | Major | Intermediate | - | Major | Intermediate | Intermediate |
Attention could also be paid to pivot points to set price objectives:
| Pivot points | S3 | S2 | S1 | PP | R1 | R2 | R3 |
|---|---|---|---|---|---|---|---|
| Standard | 540.5 | 544.1 | 549.7 | 553.3 | 558.9 | 562.5 | 568.1 |
| Camarilla | 552.7 | 553.5 | 554.4 | 555.2 | 556.0 | 556.9 | 557.7 |
| Woodie | 541.4 | 544.6 | 550.6 | 553.8 | 559.8 | 563.0 | 569.0 |
| Fibonacci | 544.1 | 547.7 | 549.8 | 553.3 | 556.9 | 559.0 | 562.5 |
| Pivot points | S3 | S2 | S1 | PP | R1 | R2 | R3 |
|---|---|---|---|---|---|---|---|
| Standard | 508.9 | 515.5 | 525.5 | 532.1 | 542.1 | 548.7 | 558.7 |
| Camarilla | 531.0 | 532.6 | 534.1 | 535.6 | 537.1 | 538.6 | 540.2 |
| Woodie | 510.7 | 516.4 | 527.3 | 533.0 | 543.9 | 549.6 | 560.5 |
| Fibonacci | 515.5 | 521.8 | 525.7 | 532.1 | 538.4 | 542.3 | 548.7 |
| Pivot points | S3 | S2 | S1 | PP | R1 | R2 | R3 |
|---|---|---|---|---|---|---|---|
| Standard | 464.9 | 479.4 | 492.4 | 506.9 | 519.9 | 534.4 | 547.4 |
| Camarilla | 497.8 | 500.4 | 502.9 | 505.4 | 507.9 | 510.4 | 513.0 |
| Woodie | 464.2 | 479.0 | 491.7 | 506.5 | 519.2 | 534.0 | 546.7 |
| Fibonacci | 479.4 | 489.9 | 496.4 | 506.9 | 517.4 | 523.9 | 534.4 |
Numerical data
The following are the details of the technical indicators and moving averages that were collected to generate this technical analysis:
| RSI (14): | 79.20 | |
| MACD (12,26,9): | 10.6000 | |
| Directional Movement: | 35.7 | |
| AROON (14): | 100.0 | |
| DEMA (21): | 540.5 | |
| Parabolic SAR (0,02-0,02-0,2): | 523.7 | |
| Elder Ray (13): | 22.0 | |
| Super Trend (3,10): | 534.3 | |
| Zig ZAG (10): | 554.0 | |
| VORTEX (21): | 1.3000 | |
| Stochastique (14,3,5): | 94.70 | |
| TEMA (21): | 548.7 | |
| Williams %R (14): | -11.60 | |
| Chande Momentum Oscillator (20): | 47.0 | |
| Repulse (5,40,3): | 0.8000 | |
| ROCnROLL: | 1 | |
| TRIX (15,9): | 0.2000 | |
| Courbe Coppock: | 14.20 |
| MA7: | 542.1 | |
| MA20: | 522.2 | |
| MA50: | 515.1 | |
| MA100: | 512.7 | |
| MAexp7: | 543.1 | |
| MAexp20: | 528.6 | |
| MAexp50: | 519.4 | |
| MAexp100: | 520.1 | |
| Price / MA7: | +1.94% | |
| Price / MA20: | +5.82% | |
| Price / MA50: | +7.28% | |
| Price / MA100: | +7.78% | |
| Price / MAexp7: | +1.75% | |
| Price / MAexp20: | +4.54% | |
| Price / MAexp50: | +6.39% | |
| Price / MAexp100: | +6.25% |
News
The latest news and videos published on SWISSCOM N at the time of the analysis were as follows:
- Neo Medical closes Swisscom Ventures-lead USD $20.6M financing round
- Swisscom Joins FreeMove
- Artificial Solutions and Swisscom Announce Partnership
- Artificial Solutions and Swisscom Announce Partnership
- Artificial Solutions and Swisscom Announce Partnership
About author
Online


Add a comment
Comments
0 comments on the analysis SWISSCOM N - Daily