CONNECTM TECHNOLOGY SOLUTIONS - 1H - Technical analysis published on 09/21/2024 (GMT)
- 140
- 0
Click here for a new analysis!
- Timeframe : 1H
- - Analysis generated on
- Status : TARGET REACHED
Summary of the analysis
Additional analysis
Quotes
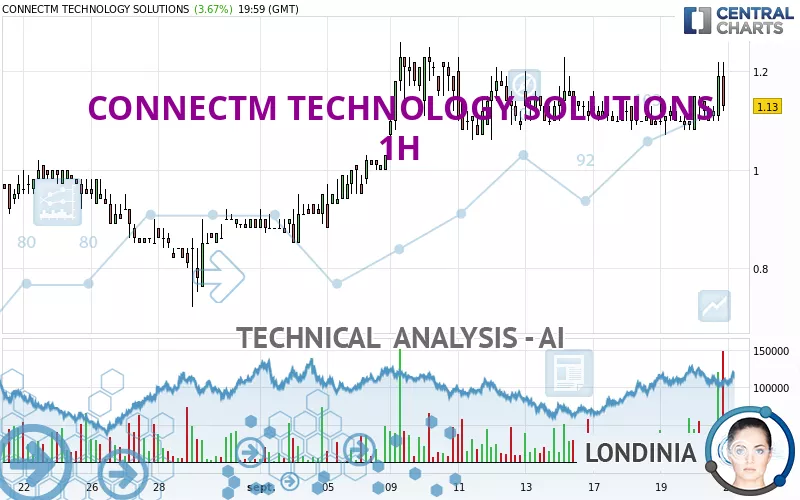
The CONNECTM TECHNOLOGY SOLUTIONS rating is 1.12 USD. The price has increased by +2.75% since the last closing with the lowest point at 1.08 USD and the highest point at 1.22 USD. The deviation from the price is +3.70% for the low point and -8.20% for the high point.The Central Gaps scanner detects a bearish opening marking the presence of sellers ahead of buyers at the opening but not sufficiently marked to allow the price to register a quotation gap.
Bearish opening
Type : Bearish
Timeframe : Openning
A study of price movements over other periods shows the following variations:
Near a new HIGH record (1 month)
Type : Bullish
Timeframe : Weekly
Abnormal volumes on CONNECTM TECHNOLOGY SOLUTIONS were detected by the Central Volumes scanner:
Abnormal volumes
Timeframe : 50 days
Technical
A technical analysis in 1H of this CONNECTM TECHNOLOGY SOLUTIONS chart shows a bullish trend. 75.00% of the signals given by moving averages are bullish. Caution: the neutral signals currently given by short-term moving averages show us that the global trend is losing momentum. The Central Indicators scanner does not detect any result on moving averages that would impact this trend.
An assessment of technical indicators shows a slightly bullish signal.
Caution: the Central Indicators scanner currently detects an excess:
CCI indicator is overbought : over 100
Type : Neutral
Timeframe : 1 hour
Previous candle closed over Bollinger bands
Type : Neutral
Timeframe : 1 hour
RSI indicator: bearish divergence
Type : Bearish
Timeframe : 1 hour
Price is back over the pivot point
Type : Bullish
Timeframe : Weekly
Williams %R indicator is back under -50
Type : Bearish
Timeframe : 1 hour
The analysis of the price chart with Central Patterns scanners does not return any result.
No result was found by the Central Candlesticks scanner on Japanese candlesticks.
| S3 | S2 | S1 | Price | R1 | R2 | R3 | |
|---|---|---|---|---|---|---|---|
| ProTrendLines | 0.72 | 0.91 | 1.06 | 1.12 | 1.15 | 1.26 | 1.66 |
| Change (%) | -35.71% | -18.75% | -5.36% | - | +2.68% | +12.50% | +48.21% |
| Change | -0.40 | -0.21 | -0.06 | - | +0.03 | +0.14 | +0.54 |
| Level | Minor | Intermediate | Intermediate | - | Intermediate | Intermediate | Minor |
Attention could also be paid to pivot points to set price objectives:
| Pivot points | S3 | S2 | S1 | PP | R1 | R2 | R3 |
|---|---|---|---|---|---|---|---|
| Standard | 0.92 | 1.00 | 1.06 | 1.14 | 1.20 | 1.28 | 1.34 |
| Camarilla | 1.08 | 1.09 | 1.11 | 1.12 | 1.13 | 1.15 | 1.16 |
| Woodie | 0.91 | 1.00 | 1.05 | 1.14 | 1.19 | 1.28 | 1.33 |
| Fibonacci | 1.00 | 1.05 | 1.09 | 1.14 | 1.19 | 1.23 | 1.28 |
| Pivot points | S3 | S2 | S1 | PP | R1 | R2 | R3 |
|---|---|---|---|---|---|---|---|
| Standard | 0.89 | 0.98 | 1.05 | 1.14 | 1.21 | 1.30 | 1.37 |
| Camarilla | 1.08 | 1.09 | 1.11 | 1.12 | 1.14 | 1.15 | 1.16 |
| Woodie | 0.88 | 0.98 | 1.04 | 1.14 | 1.20 | 1.30 | 1.36 |
| Fibonacci | 0.98 | 1.04 | 1.08 | 1.14 | 1.20 | 1.24 | 1.30 |
| Pivot points | S3 | S2 | S1 | PP | R1 | R2 | R3 |
|---|---|---|---|---|---|---|---|
| Standard | -0.74 | -0.03 | 0.42 | 1.13 | 1.58 | 2.29 | 2.74 |
| Camarilla | 0.56 | 0.67 | 0.77 | 0.88 | 0.99 | 1.09 | 1.20 |
| Woodie | -0.86 | -0.10 | 0.30 | 1.07 | 1.46 | 2.23 | 2.62 |
| Fibonacci | -0.03 | 0.41 | 0.68 | 1.13 | 1.57 | 1.84 | 2.29 |
Numerical data
The following is the status of the technical indicators and moving averages at the time of publication of this technical analysis:
| RSI (14): | 51.72 | |
| MACD (12,26,9): | 0.0100 | |
| Directional Movement: | 20.18 | |
| AROON (14): | 78.57 | |
| DEMA (21): | 1.13 | |
| Parabolic SAR (0,02-0,02-0,2): | 1.07 | |
| Elder Ray (13): | 0.04 | |
| Super Trend (3,10): | 1.05 | |
| Zig ZAG (10): | 1.13 | |
| VORTEX (21): | 1.0200 | |
| Stochastique (14,3,5): | 59.61 | |
| TEMA (21): | 1.13 | |
| Williams %R (14): | -60.00 | |
| Chande Momentum Oscillator (20): | 0.02 | |
| Repulse (5,40,3): | -2.9300 | |
| ROCnROLL: | 1 | |
| TRIX (15,9): | 0.0000 | |
| Courbe Coppock: | 5.35 |
| MA7: | 1.11 | |
| MA20: | 1.02 | |
| MA50: | 1.21 | |
| MA100: | 6.13 | |
| MAexp7: | 1.13 | |
| MAexp20: | 1.12 | |
| MAexp50: | 1.11 | |
| MAexp100: | 1.08 | |
| Price / MA7: | +0.90% | |
| Price / MA20: | +9.80% | |
| Price / MA50: | -7.44% | |
| Price / MA100: | -81.73% | |
| Price / MAexp7: | -0% | |
| Price / MAexp20: | +0.89% | |
| Price / MAexp50: | +1.80% | |
| Price / MAexp100: | +4.63% |
News
The last news published on CONNECTM TECHNOLOGY SOLUTIONS at the time of the generation of this analysis was as follows:
- ConnectM Successfully Eliminates $7.5 Million in Debt, Reaching Halfway Mark in Debt-To-Equity Conversion
- ConnectM Prepares to Deleverage Balance Sheet with Board’s Approval of Debt-to-Equity Conversion
- ConnectM Publishes New Investor Materials
- ConnectM Ranks No. 104 on the Inc. 5000
- ConnectM Publishes Impact Scorecard for the Six Months Ended June 30, 2024
About author

Online


Add a comment
Comments
0 comments on the analysis CONNECTM TECHNOLOGY SOLUTIONS - 1H