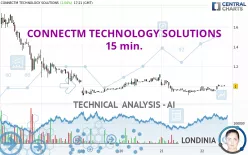
CONNECTM TECHNOLOGY SOLUTIONS - 15 min. - Technical analysis published on 08/22/2024 (GMT)
- 118
- 0
Click here for a new analysis!
- Timeframe : 15 min.
- - Analysis generated on
- Status : TARGET REACHED

Summary of the analysis
Additional analysis
Quotes
The CONNECTM TECHNOLOGY SOLUTIONS price is 1.0000 USD. The price has increased by +2.04% since the last closing with the lowest point at 0.9500 USD and the highest point at 1.0200 USD. The deviation from the price is +5.26% for the low point and -1.96% for the high point.A bearish opening was detected by the Central Gaps scanner. Sellers are trying to impose a bearish trend in the very short term.
Bearish opening
Type : Bearish
Timeframe : Openning
So that you have an overall view of the price change, here is a table showing the variations over several periods:
Abnormal volumes
Timeframe : 5 days
Abnormal volumes
Timeframe : 20 days
Abnormal volumes
Timeframe : 50 days
Technical
Technical analysis of this 15 min. chart of CONNECTM TECHNOLOGY SOLUTIONS indicates that the overall trend is bearish. 71.43% of the signals given by moving averages are bearish. Caution: the neutral signals currently given by short-term moving averages show us that the global trend is losing momentum. The Central Indicators market scanner is currently detecting several bearish and bullish signals that could impact this trend:
Bullish trend reversal : adaptative moving average 20
Type : Bullish
Timeframe : 15 minutes
Bullish price crossover with Moving Average 50
Type : Bullish
Timeframe : 15 minutes
Bullish price crossover with Moving Average 100
Type : Bullish
Timeframe : 15 minutes
Bearish price crossover with adaptative moving average 50
Type : Bearish
Timeframe : 15 minutes
Bearish price crossover with adaptative moving average 100
Type : Bearish
Timeframe : 15 minutes
In fact, 11 technical indicators on 18 studied are currently positioned bullish. Caution: the Central Indicators scanner currently detects an excess:
CCI indicator is overbought : over 100
Type : Neutral
Timeframe : 15 minutes
Previous candle closed over Bollinger bands
Type : Neutral
Timeframe : 15 minutes
RSI indicator is back over 50
Type : Bullish
Timeframe : 15 minutes
No signals are given by Central Patterns, a market scanner specialised in chart patterns, resistances and supports.
The presence of a bullish Japanese candlestick pattern detected by Central Candlesticks that could cause a very short term rebound was also detected:
Bullish harami
Type : Bullish
Timeframe : 15 minutes
| S2 | S1 | Price | R1 | R2 | R3 | |
|---|---|---|---|---|---|---|
| ProTrendLines | 0.6700 | 0.9100 | 1.0000 | 1.8300 | 2.2000 | 2.6300 |
| Change (%) | -33.00% | -9.00% | - | +83.00% | +120.00% | +163.00% |
| Change | -0.3300 | -0.0900 | - | +0.8300 | +1.2000 | +1.6300 |
| Level | Minor | Intermediate | - | Intermediate | Minor | Intermediate |
Attention could also be paid to pivot points to set price objectives:
| Pivot points | S3 | S2 | S1 | PP | R1 | R2 | R3 |
|---|---|---|---|---|---|---|---|
| Standard | 0.7433 | 0.8267 | 0.9033 | 0.9867 | 1.0633 | 1.1467 | 1.2233 |
| Camarilla | 0.9360 | 0.9507 | 0.9653 | 0.9800 | 0.9947 | 1.0093 | 1.0240 |
| Woodie | 0.7400 | 0.8250 | 0.9000 | 0.9850 | 1.0600 | 1.1450 | 1.2200 |
| Fibonacci | 0.8267 | 0.8878 | 0.9256 | 0.9867 | 1.0478 | 1.0856 | 1.1467 |
| Pivot points | S3 | S2 | S1 | PP | R1 | R2 | R3 |
|---|---|---|---|---|---|---|---|
| Standard | -0.3000 | 0.2800 | 0.6700 | 1.2500 | 1.6400 | 2.2200 | 2.6100 |
| Camarilla | 0.7933 | 0.8822 | 0.9711 | 1.0600 | 1.1489 | 1.2378 | 1.3268 |
| Woodie | -0.3950 | 0.2325 | 0.5750 | 1.2025 | 1.5450 | 2.1725 | 2.5150 |
| Fibonacci | 0.2800 | 0.6505 | 0.8795 | 1.2500 | 1.6205 | 1.8495 | 2.2200 |
| Pivot points | S3 | S2 | S1 | PP | R1 | R2 | R3 |
|---|---|---|---|---|---|---|---|
| Standard | -13.0700 | -6.1200 | -2.6000 | 4.3500 | 7.8700 | 14.8200 | 18.3400 |
| Camarilla | -1.9593 | -0.9995 | -0.0398 | 0.9200 | 1.8798 | 2.8395 | 3.7993 |
| Woodie | -14.7850 | -6.9775 | -4.3150 | 3.4925 | 6.1550 | 13.9625 | 16.6250 |
| Fibonacci | -6.1200 | -2.1205 | 0.3505 | 4.3500 | 8.3495 | 10.8205 | 14.8200 |
Numerical data
The following is the status of technical indicators and moving averages registered at the time this technical analysis was created:
| RSI (14): | 48.15 | |
| MACD (12,26,9): | -0.0200 | |
| Directional Movement: | -0.7100 | |
| AROON (14): | 57.1400 | |
| DEMA (21): | 0.9400 | |
| Parabolic SAR (0,02-0,02-0,2): | 0.9100 | |
| Elder Ray (13): | 0.0100 | |
| Super Trend (3,10): | 1.0100 | |
| Zig ZAG (10): | 0.9700 | |
| VORTEX (21): | 0.8000 | |
| Stochastique (14,3,5): | 71.43 | |
| TEMA (21): | 0.9400 | |
| Williams %R (14): | -28.00 | |
| Chande Momentum Oscillator (20): | 0.0100 | |
| Repulse (5,40,3): | 0.2300 | |
| ROCnROLL: | -1 | |
| TRIX (15,9): | -0.3000 | |
| Courbe Coppock: | 3.46 |
| MA7: | 1.2300 | |
| MA20: | 1.0300 | |
| MA50: | 5.3000 | |
| MA100: | 8.2400 | |
| MAexp7: | 0.9600 | |
| MAexp20: | 0.9700 | |
| MAexp50: | 1.0000 | |
| MAexp100: | 1.0500 | |
| Price / MA7: | -18.70% | |
| Price / MA20: | -2.91% | |
| Price / MA50: | -81.13% | |
| Price / MA100: | -87.86% | |
| Price / MAexp7: | +4.17% | |
| Price / MAexp20: | +3.09% | |
| Price / MAexp50: | -0% | |
| Price / MAexp100: | -4.76% |
News
The last news published on CONNECTM TECHNOLOGY SOLUTIONS at the time of the generation of this analysis was as follows:
- ConnectM Publishes New Investor Materials
- ConnectM Ranks No. 104 on the Inc. 5000
- ConnectM Publishes Impact Scorecard for the Six Months Ended June 30, 2024
- ConnectM Announces Agreement to Acquire a Controlling Interest in DeliveryCircle
About author

Online


Add a comment
Comments
0 comments on the analysis CONNECTM TECHNOLOGY SOLUTIONS - 15 min.