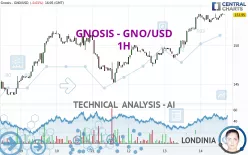
GNOSIS - GNO/USD - 1H - Technical analysis published on 09/14/2024 (GMT)
- 117
- 0
Click here for a new analysis!
- Timeframe : 1H
- - Analysis generated on
- Status : LEVEL MAINTAINED

Summary of the analysis

Additional analysis
Quotes
GNOSIS - GNO/USD rating 153.95 USD. The price registered a decrease of -0.01% on the session and was traded between 152.91 USD and 154.13 USD over the period. The price is currently at +0.68% from its lowest and -0.12% from its highest.The Central Gaps scanner detects a bearish opening marking the presence of sellers ahead of buyers at the opening but not sufficiently marked to allow the price to register a quotation gap.
Bearish opening
Type : Bearish
Timeframe : Openning
So that you have an overall view of the price change, here is a table showing the variations over several periods:
New HIGH record (1st january)
Type : Bullish
Timeframe : Weekly
Technical
Technical analysis of this 1H chart of GNOSIS - GNO/USD indicates that the overall trend is strongly bullish. 92.86% of the signals given by moving averages are bullish. The overall trend is supported by the strong bullish signals from short-term moving averages. The Central Indicators scanner does not detect any result on moving averages that would impact this trend.
The technical indicators are bullish. There is still some doubt about the price increase.
Caution: the Central Indicators scanner currently detects an excess:
CCI indicator is overbought : over 100
Type : Neutral
Timeframe : 1 hour
CCI indicator: bearish divergence
Type : Bearish
Timeframe : 1 hour
Williams %R indicator is overbought : over -20
Type : Neutral
Timeframe : 1 hour
Pivot points : price is over resistance 1
Type : Neutral
Timeframe : Weekly
Central Patterns, the scanner specializing in chart patterns, did not identify any signals.
The Central Candlesticks scanner, specialised in Japanese candlesticks, did not identify any signals.
| S3 | S2 | S1 | Price | R1 | R2 | R3 | |
|---|---|---|---|---|---|---|---|
| ProTrendLines | 145.14 | 150.09 | 151.95 | 153.95 | 181.16 | 265.64 | 373.04 |
| Change (%) | -5.72% | -2.51% | -1.30% | - | +17.67% | +72.55% | +142.31% |
| Change | -8.81 | -3.86 | -2.00 | - | +27.21 | +111.69 | +219.09 |
| Level | Minor | Intermediate | Intermediate | - | Minor | Intermediate | Intermediate |
Attention could also be paid to pivot points to set price objectives:
| Pivot points | S3 | S2 | S1 | PP | R1 | R2 | R3 |
|---|---|---|---|---|---|---|---|
| Standard | 144.46 | 146.39 | 150.17 | 152.10 | 155.88 | 157.81 | 161.59 |
| Camarilla | 152.39 | 152.91 | 153.44 | 153.96 | 154.48 | 155.01 | 155.53 |
| Woodie | 145.40 | 146.85 | 151.11 | 152.56 | 156.82 | 158.27 | 162.53 |
| Fibonacci | 146.39 | 148.57 | 149.92 | 152.10 | 154.28 | 155.63 | 157.81 |
| Pivot points | S3 | S2 | S1 | PP | R1 | R2 | R3 |
|---|---|---|---|---|---|---|---|
| Standard | 116.72 | 127.76 | 135.20 | 146.24 | 153.68 | 164.72 | 172.16 |
| Camarilla | 137.55 | 139.24 | 140.94 | 142.63 | 144.32 | 146.02 | 147.71 |
| Woodie | 114.91 | 126.86 | 133.39 | 145.34 | 151.87 | 163.82 | 170.35 |
| Fibonacci | 127.76 | 134.82 | 139.18 | 146.24 | 153.30 | 157.66 | 164.72 |
| Pivot points | S3 | S2 | S1 | PP | R1 | R2 | R3 |
|---|---|---|---|---|---|---|---|
| Standard | 48.72 | 89.43 | 120.24 | 160.95 | 191.76 | 232.47 | 263.28 |
| Camarilla | 131.38 | 137.94 | 144.49 | 151.05 | 157.61 | 164.16 | 170.72 |
| Woodie | 43.77 | 86.96 | 115.29 | 158.48 | 186.81 | 230.00 | 258.33 |
| Fibonacci | 89.43 | 116.75 | 133.63 | 160.95 | 188.27 | 205.15 | 232.47 |
Numerical data
The following is the status of technical indicators and moving averages registered at the time this technical analysis was created:
| RSI (14): | 67.74 | |
| MACD (12,26,9): | 0.6900 | |
| Directional Movement: | 26.45 | |
| AROON (14): | 57.15 | |
| DEMA (21): | 154.24 | |
| Parabolic SAR (0,02-0,02-0,2): | 153.07 | |
| Elder Ray (13): | 0.41 | |
| Super Trend (3,10): | 152.98 | |
| Zig ZAG (10): | 153.98 | |
| VORTEX (21): | 1.2400 | |
| Stochastique (14,3,5): | 89.98 | |
| TEMA (21): | 154.14 | |
| Williams %R (14): | -14.93 | |
| Chande Momentum Oscillator (20): | 0.09 | |
| Repulse (5,40,3): | 0.1400 | |
| ROCnROLL: | 1 | |
| TRIX (15,9): | 0.0800 | |
| Courbe Coppock: | 0.39 |
| MA7: | 150.46 | |
| MA20: | 151.01 | |
| MA50: | 166.78 | |
| MA100: | 225.49 | |
| MAexp7: | 153.78 | |
| MAexp20: | 153.23 | |
| MAexp50: | 151.83 | |
| MAexp100: | 150.53 | |
| Price / MA7: | +2.32% | |
| Price / MA20: | +1.95% | |
| Price / MA50: | -7.69% | |
| Price / MA100: | -31.73% | |
| Price / MAexp7: | +0.11% | |
| Price / MAexp20: | +0.47% | |
| Price / MAexp50: | +1.40% | |
| Price / MAexp100: | +2.27% |
About author
Online


Add a comment
Comments
0 comments on the analysis GNOSIS - GNO/USD - 1H