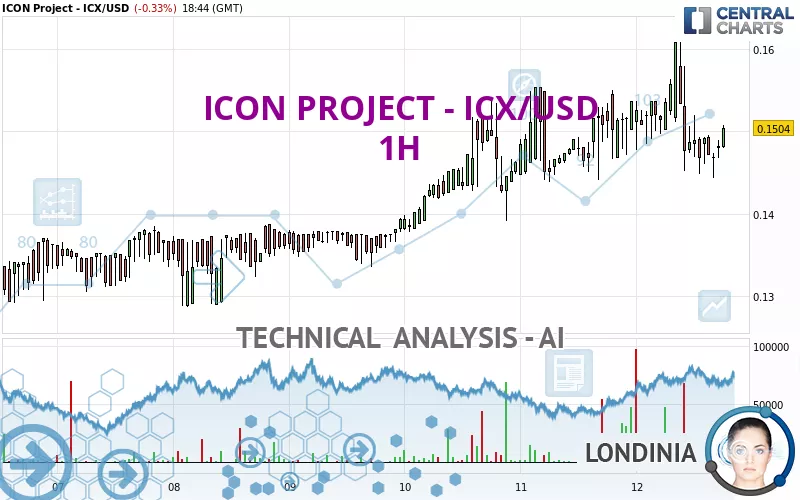
ICON PROJECT - ICX/USD - 1H - Technical analysis published on 11/12/2024 (GMT)
- 124
- 0
Click here for a new analysis!
- Timeframe : 1H
- - Analysis generated on
- Status : INVALID
Summary of the analysis

Additional analysis
Quotes
The ICON PROJECT - ICX/USD price is 0.150400 USD. On the day, this instrument lost -0.33% and was between 0.144300 USD and 0.160800 USD. This implies that the price is at +4.23% from its lowest and at -6.47% from its highest.The Central Gaps scanner detects a bullish opening marking the presence of buyers ahead of sellers at the opening but not sufficiently marked to allow the price to register a quotation gap.
Bullish opening
Type : Bullish
Timeframe : Openning
So that you have an overall view of the price change, here is a table showing the variations over several periods:
New HIGH record (1st january)
Type : Bullish
Timeframe : Weekly
New HIGH record (1 month)
Type : Bullish
Timeframe : Weekly
The Central Volumes scanner notes the presence of abnormal volumes:
Abnormal volumes
Timeframe : 5 days
Technical
Technical analysis of this 1H chart of ICON PROJECT - ICX/USD indicates that the overall trend is bullish. 78.57% of the signals given by moving averages are bullish. Caution: the neutral signals currently given by short-term moving averages show us that the global trend is losing momentum. An assessment of moving averages reveals several bullish signals that could impact this trend:
Bullish price crossover with Moving Average 50
Type : Bullish
Timeframe : 1 hour
Bullish price crossover with adaptative moving average 20
Type : Bullish
Timeframe : 1 hour
Bullish price crossover with adaptative moving average 50
Type : Bullish
Timeframe : 1 hour
An assessment of technical indicators does not currently provide any relevant information to suggest whether the signal given by the technical indicators is more bullish or bearish.
Central Indicators, the detector scanner for these technical indicators recently detected a signal:
Pivot points : price is over resistance 1
Type : Neutral
Timeframe : Weekly
Central Patterns, the scanner specializing in chart patterns, did not identify any signals.
The Central Candlesticks scanner, specialised in Japanese candlesticks, did not identify any signals.
| S3 | S2 | S1 | Price | R1 | R2 | R3 | |
|---|---|---|---|---|---|---|---|
| ProTrendLines | 0.138833 | 0.144060 | 0.147588 | 0.150400 | 0.155240 | 0.170500 | 0.206700 |
| Change (%) | -7.69% | -4.22% | -1.87% | - | +3.22% | +13.36% | +37.43% |
| Change | -0.011567 | -0.006340 | -0.002812 | - | +0.004840 | +0.020100 | +0.056300 |
| Level | Intermediate | Intermediate | Major | - | Intermediate | Intermediate | Minor |
Attention could also be paid to pivot points to set price objectives:
| Pivot points | S3 | S2 | S1 | PP | R1 | R2 | R3 |
|---|---|---|---|---|---|---|---|
| Standard | 0.133367 | 0.138633 | 0.144767 | 0.150033 | 0.156167 | 0.161433 | 0.167567 |
| Camarilla | 0.147765 | 0.148810 | 0.149855 | 0.150900 | 0.151945 | 0.152990 | 0.154035 |
| Woodie | 0.133800 | 0.138850 | 0.145200 | 0.150250 | 0.156600 | 0.161650 | 0.168000 |
| Fibonacci | 0.138633 | 0.142988 | 0.145679 | 0.150033 | 0.154388 | 0.157079 | 0.161433 |
| Pivot points | S3 | S2 | S1 | PP | R1 | R2 | R3 |
|---|---|---|---|---|---|---|---|
| Standard | 0.096600 | 0.105200 | 0.122300 | 0.130900 | 0.148000 | 0.156600 | 0.173700 |
| Camarilla | 0.132333 | 0.134688 | 0.137044 | 0.139400 | 0.141756 | 0.144112 | 0.146468 |
| Woodie | 0.100850 | 0.107325 | 0.126550 | 0.133025 | 0.152250 | 0.158725 | 0.177950 |
| Fibonacci | 0.105200 | 0.115017 | 0.121083 | 0.130900 | 0.140717 | 0.146783 | 0.156600 |
| Pivot points | S3 | S2 | S1 | PP | R1 | R2 | R3 |
|---|---|---|---|---|---|---|---|
| Standard | 0.080433 | 0.100267 | 0.114033 | 0.133867 | 0.147633 | 0.167467 | 0.181233 |
| Camarilla | 0.118560 | 0.121640 | 0.124720 | 0.127800 | 0.130880 | 0.133960 | 0.137040 |
| Woodie | 0.077400 | 0.098750 | 0.111000 | 0.132350 | 0.144600 | 0.165950 | 0.178200 |
| Fibonacci | 0.100267 | 0.113102 | 0.121032 | 0.133867 | 0.146702 | 0.154632 | 0.167467 |
Numerical data
The following is the status of technical indicators and moving averages registered at the time this technical analysis was created:
| RSI (14): | 49.53 | |
| MACD (12,26,9): | -0.0006 | |
| Directional Movement: | -4.523293 | |
| AROON (14): | -57.142857 | |
| DEMA (21): | 0.149595 | |
| Parabolic SAR (0,02-0,02-0,2): | 0.156767 | |
| Elder Ray (13): | -0.000583 | |
| Super Trend (3,10): | 0.142479 | |
| Zig ZAG (10): | 0.150300 | |
| VORTEX (21): | 0.9806 | |
| Stochastique (14,3,5): | 25.25 | |
| TEMA (21): | 0.148315 | |
| Williams %R (14): | -61.21 | |
| Chande Momentum Oscillator (20): | -0.002800 | |
| Repulse (5,40,3): | 2.1662 | |
| ROCnROLL: | 1 | |
| TRIX (15,9): | 0.0075 | |
| Courbe Coppock: | 5.40 |
| MA7: | 0.142014 | |
| MA20: | 0.132740 | |
| MA50: | 0.138812 | |
| MA100: | 0.134523 | |
| MAexp7: | 0.148962 | |
| MAexp20: | 0.149915 | |
| MAexp50: | 0.148809 | |
| MAexp100: | 0.145102 | |
| Price / MA7: | +5.91% | |
| Price / MA20: | +13.30% | |
| Price / MA50: | +8.35% | |
| Price / MA100: | +11.80% | |
| Price / MAexp7: | +0.97% | |
| Price / MAexp20: | +0.32% | |
| Price / MAexp50: | +1.07% | |
| Price / MAexp100: | +3.65% |
About author
Online


Add a comment
Comments
0 comments on the analysis ICON PROJECT - ICX/USD - 1H