| Open: | 0.169472 |
| Change: | +0.000364 |
| Volume: | 13,013 |
| Low: | 0.167918 |
| High: | 0.172662 |
| High / Low range: | 0.004744 |
| Type: | Cryptocurrencies |
| Ticker: | STORJUSDT |
| ISIN: |
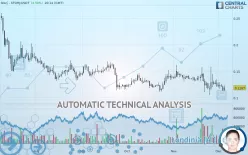
STORJ - STORJ/USDT - Daily - Technical analysis published on 12/05/2019 (GMT)
- 213
- 0
- 12/05/2019 - 20:15
- Who voted?
Click here for a new analysis!
- Timeframe : Daily
- - Analysis generated on 12/05/2019 - 20:14
- Status : TARGET REACHED

Summary of the analysis

Additional analysis
Quotes
The STORJ - STORJ/USDT price is 0.118700 USDT. On the day, this instrument gained +4.58% and was traded between 0.112700 USDT and 0.123600 USDT over the period. The price is currently at +5.32% from its lowest and -3.96% from its highest.The Central Gaps scanner detects a bullish opening marking the presence of buyers ahead of sellers at the opening but not sufficiently marked to allow the price to register a quotation gap.
Bullish opening
Type : Bullish
Timeframe : Openning
Here is a more detailed summary of the historical variations registered by STORJ - STORJ/USDT:
Technical
A technical analysis in Daily of this STORJ - STORJ/USDT chart shows a sharp bearish trend. 92.86% of the signals given by moving averages are bearish. This strongly bearish trend is supported by the strong bearish signals given by short-term moving averages. The Central Indicators scanner does not detect any result on moving averages that would impact this trend.
On the 18 technical indicators analysed, 5 are bullish, 5 are neutral and 8 are bearish. Caution: the Central Indicators scanner currently detects an excess:
CCI indicator is oversold : under -100
Type : Neutral
Timeframe : Daily
Williams %R indicator is oversold : under -80
Type : Neutral
Timeframe : Daily
Ichimoku - Bullish crossover : Tenkan & Kijun
Type : Bullish
Timeframe : Daily
Price is back under the pivot point
Type : Bearish
Timeframe : Daily
Central Patterns, the market scanner focusing on chart patterns, resistances and supports found this result:
Horizontal support is broken
Type : Bearish
Timeframe : Daily
The Central Candlesticks scanner, specialised in Japanese candlesticks, did not identify any signals.
| S1 | Price | R1 | R2 | R3 | |
|---|---|---|---|---|---|
| ProTrendLines | 0.118107 | 0.118700 | 0.150247 | 0.193700 | 0.273220 |
| Change (%) | -0.50% | - | +26.58% | +63.18% | +130.18% |
| Change | -0.000593 | - | +0.031547 | +0.075000 | +0.154520 |
| Level | Major | - | Intermediate | Minor | Minor |
Attention could also be paid to pivot points to set price objectives:
| Pivot points | S3 | S2 | S1 | PP | R1 | R2 | R3 |
|---|---|---|---|---|---|---|---|
| Standard | 0.100333 | 0.106567 | 0.110033 | 0.116267 | 0.119733 | 0.125967 | 0.129433 |
| Camarilla | 0.110833 | 0.111722 | 0.112611 | 0.113500 | 0.114389 | 0.115278 | 0.116168 |
| Woodie | 0.098950 | 0.105875 | 0.108650 | 0.115575 | 0.118350 | 0.125275 | 0.128050 |
| Fibonacci | 0.106567 | 0.110272 | 0.112561 | 0.116267 | 0.119972 | 0.122261 | 0.125967 |
| Pivot points | S3 | S2 | S1 | PP | R1 | R2 | R3 |
|---|---|---|---|---|---|---|---|
| Standard | 0.044133 | 0.074367 | 0.098133 | 0.128367 | 0.152133 | 0.182367 | 0.206133 |
| Camarilla | 0.107050 | 0.112000 | 0.116950 | 0.121900 | 0.126850 | 0.131800 | 0.136750 |
| Woodie | 0.040900 | 0.072750 | 0.094900 | 0.126750 | 0.148900 | 0.180750 | 0.202900 |
| Fibonacci | 0.074367 | 0.094995 | 0.107739 | 0.128367 | 0.148995 | 0.161739 | 0.182367 |
| Pivot points | S3 | S2 | S1 | PP | R1 | R2 | R3 |
|---|---|---|---|---|---|---|---|
| Standard | 0.039733 | 0.072167 | 0.097033 | 0.129467 | 0.154333 | 0.186767 | 0.211633 |
| Camarilla | 0.106143 | 0.111395 | 0.116648 | 0.121900 | 0.127153 | 0.132405 | 0.137658 |
| Woodie | 0.035950 | 0.070275 | 0.093250 | 0.127575 | 0.150550 | 0.184875 | 0.207850 |
| Fibonacci | 0.072167 | 0.094055 | 0.107578 | 0.129467 | 0.151355 | 0.164878 | 0.186767 |
Numerical data
The following are the details of the technical indicators and moving averages that were collected to generate this technical analysis:
| RSI (14): | 42.14 | |
| MACD (12,26,9): | -0.0042 | |
| Directional Movement: | -0.968908 | |
| AROON (14): | 7.142859 | |
| DEMA (21): | 0.120744 | |
| Parabolic SAR (0,02-0,02-0,2): | 0.112659 | |
| Elder Ray (13): | -0.005166 | |
| Super Trend (3,10): | 0.149264 | |
| Zig ZAG (10): | 0.119200 | |
| VORTEX (21): | 0.9327 | |
| Stochastique (14,3,5): | 24.38 | |
| TEMA (21): | 0.117790 | |
| Williams %R (14): | -73.89 | |
| Chande Momentum Oscillator (20): | -0.008000 | |
| Repulse (5,40,3): | -6.1565 | |
| ROCnROLL: | 2 | |
| TRIX (15,9): | -0.3514 | |
| Courbe Coppock: | 18.02 |
| MA7: | 0.121357 | |
| MA20: | 0.127170 | |
| MA50: | 0.130988 | |
| MA100: | 0.135503 | |
| MAexp7: | 0.120663 | |
| MAexp20: | 0.125698 | |
| MAexp50: | 0.130819 | |
| MAexp100: | 0.141735 | |
| Price / MA7: | -2.19% | |
| Price / MA20: | -6.66% | |
| Price / MA50: | -9.38% | |
| Price / MA100: | -12.40% | |
| Price / MAexp7: | -1.63% | |
| Price / MAexp20: | -5.57% | |
| Price / MAexp50: | -9.26% | |
| Price / MAexp100: | -16.25% |
About author

Online


Add a comment
Comments
0 comments on the analysis STORJ - STORJ/USDT - Daily