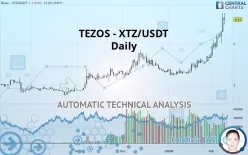
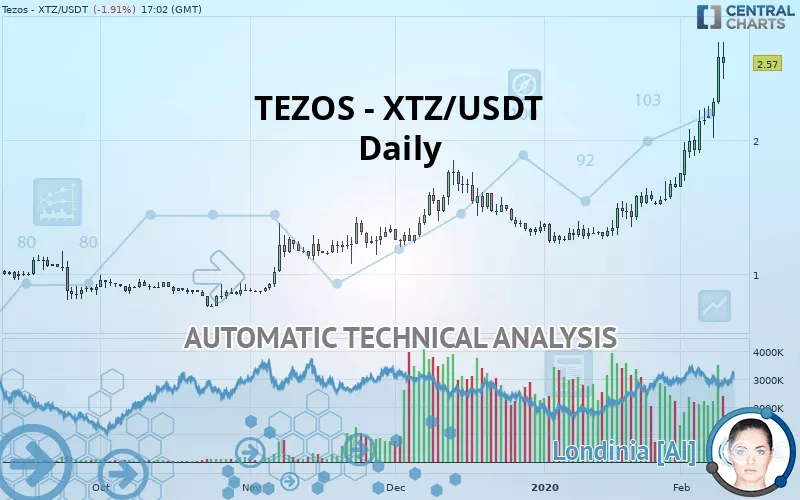
TEZOS - XTZ/USDT - Daily - Technical analysis published on 02/10/2020 (GMT)
- 147
- 0
- Who voted?
Click here for a new analysis!
- Timeframe : Daily
- - Analysis generated on
- Status : TARGET REACHED
Summary of the analysis

Additional analysis
Quotes
TEZOS - XTZ/USDT rating 2.57 USDT. The price has increased by -1.91% since the last closing with the lowest point at 2.45 USDT and the highest point at 2.73 USDT. The deviation from the price is +4.90% for the low point and -5.86% for the high point.The Central Gaps scanner detects a bullish opening marking the presence of buyers ahead of sellers at the opening but not sufficiently marked to allow the price to register a quotation gap.
Bullish opening
Type : Bullish
Timeframe : Openning
So that you have an overall view of the price change, here is a table showing the variations over several periods:
Near a new HIGH record (1st january)
Type : Bullish
Timeframe : Weekly
Near a new HIGH record (1 month)
Type : Bullish
Timeframe : Weekly
The Central Volumes scanner detects abnormal volumes on the asset:
Abnormal volumes
Timeframe : 5 days
Abnormal volumes
Timeframe : 20 days
Abnormal volumes
Timeframe : 50 days
Technical
Technical analysis of TEZOS - XTZ/USDT in Daily shows a strongly overall bullish trend. The signals given by the moving averages are 92.86% bullish. This strong bullish trend is confirmed by the strong signals currently being given by short-term moving averages. The Central Indicators scanner does not detect any result on moving averages that would impact this trend.
Technical indicators are strongly bullish, suggesting that the price increase should continue.
But beware of excesses. The Central Indicators scanner currently detects this:
RSI indicator is overbought : over 80
Type : Neutral
Timeframe : Daily
CCI indicator is overbought : over 100
Type : Neutral
Timeframe : Daily
Williams %R indicator is overbought : over -20
Type : Neutral
Timeframe : Daily
Pivot points : price is over resistance 1
Type : Neutral
Timeframe : Weekly
Price is back over the pivot point
Type : Bullish
Timeframe : Daily
An analysis of the price chart with the Central Patterns scanner (detector of chart patterns and resistances and supports) shows a result that can have an impact on the price change:
Near horizontal resistance
Type : Bearish
Timeframe : Daily
Central Candlesticks, the scanner specialised in Japanese candlesticks, detects a bullish signal that could support the hypothesis of a small rebound in the very short term:
Long white line
Type : Bullish
Timeframe : Daily
| S3 | S2 | S1 | Price | R1 | R2 | R3 | |
|---|---|---|---|---|---|---|---|
| ProTrendLines | 1.24 | 1.59 | 1.77 | 2.57 | 2.67 | 5.26 | 5.80 |
| Change (%) | -51.75% | -38.13% | -31.13% | - | +3.89% | +104.67% | +125.68% |
| Change | -1.33 | -0.98 | -0.80 | - | +0.10 | +2.69 | +3.23 |
| Level | Intermediate | Minor | Major | - | Minor | Minor | Major |
Attention could also be paid to pivot points to set price objectives:
| Pivot points | S3 | S2 | S1 | PP | R1 | R2 | R3 |
|---|---|---|---|---|---|---|---|
| Standard | 1.88 | 2.08 | 2.35 | 2.54 | 2.81 | 3.01 | 3.28 |
| Camarilla | 2.49 | 2.54 | 2.58 | 2.62 | 2.66 | 2.71 | 2.75 |
| Woodie | 1.92 | 2.10 | 2.39 | 2.56 | 2.85 | 3.03 | 3.32 |
| Fibonacci | 2.08 | 2.26 | 2.36 | 2.54 | 2.72 | 2.83 | 3.01 |
| Pivot points | S3 | S2 | S1 | PP | R1 | R2 | R3 |
|---|---|---|---|---|---|---|---|
| Standard | 1.27 | 1.48 | 1.88 | 2.09 | 2.49 | 2.71 | 3.11 |
| Camarilla | 2.11 | 2.17 | 2.23 | 2.28 | 2.34 | 2.39 | 2.45 |
| Woodie | 1.36 | 1.53 | 1.98 | 2.14 | 2.59 | 2.75 | 3.20 |
| Fibonacci | 1.48 | 1.71 | 1.86 | 2.09 | 2.33 | 2.47 | 2.71 |
| Pivot points | S3 | S2 | S1 | PP | R1 | R2 | R3 |
|---|---|---|---|---|---|---|---|
| Standard | 0.85 | 1.04 | 1.35 | 1.53 | 1.84 | 2.02 | 2.33 |
| Camarilla | 1.52 | 1.56 | 1.61 | 1.65 | 1.70 | 1.74 | 1.79 |
| Woodie | 0.91 | 1.07 | 1.41 | 1.56 | 1.90 | 2.06 | 2.39 |
| Fibonacci | 1.04 | 1.23 | 1.34 | 1.53 | 1.72 | 1.84 | 2.02 |
Numerical data
The following are the details of the technical indicators and moving averages that were collected to generate this technical analysis:
| RSI (14): | 85.48 | |
| MACD (12,26,9): | 0.2700 | |
| Directional Movement: | 29.77 | |
| AROON (14): | 92.86 | |
| DEMA (21): | 2.28 | |
| Parabolic SAR (0,02-0,02-0,2): | 2.01 | |
| Elder Ray (13): | 0.47 | |
| Super Trend (3,10): | 1.99 | |
| Zig ZAG (10): | 2.62 | |
| VORTEX (21): | 1.2800 | |
| Stochastique (14,3,5): | 92.87 | |
| TEMA (21): | 2.46 | |
| Williams %R (14): | -9.12 | |
| Chande Momentum Oscillator (20): | 1.06 | |
| Repulse (5,40,3): | 18.0100 | |
| ROCnROLL: | 1 | |
| TRIX (15,9): | 1.7100 | |
| Courbe Coppock: | 96.15 |
| MA7: | 2.27 | |
| MA20: | 1.86 | |
| MA50: | 1.56 | |
| MA100: | 1.42 | |
| MAexp7: | 2.32 | |
| MAexp20: | 1.96 | |
| MAexp50: | 1.67 | |
| MAexp100: | 1.49 | |
| Price / MA7: | +13.22% | |
| Price / MA20: | +38.17% | |
| Price / MA50: | +64.74% | |
| Price / MA100: | +80.99% | |
| Price / MAexp7: | +10.78% | |
| Price / MAexp20: | +31.12% | |
| Price / MAexp50: | +53.89% | |
| Price / MAexp100: | +72.48% |
About author

Online


Add a comment
Comments
0 comments on the analysis TEZOS - XTZ/USDT - Daily