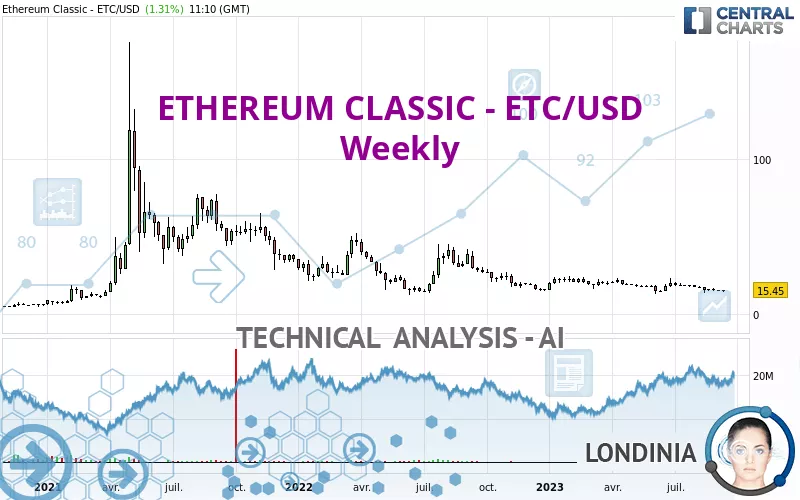
ETHEREUM CLASSIC - ETC/USD - Weekly - Technical analysis published on 09/15/2023 (GMT)
- 159
- 0
Click here for a new analysis!
- Timeframe : Weekly
- - Analysis generated on
- Status : INVALID
Summary of the analysis

Additional analysis
Quotes
The ETHEREUM CLASSIC - ETC/USD price is 15.45 USD. Over 5 days, this instrument gained +0.26% and was traded between 14.47 USD and 15.51 USD over the period. The price is currently at +6.77% from its lowest point and -0.39% from its highest point.The Central Gaps scanner detects a bearish opening. A small advantage for sellers in the very short term.
Bearish opening
Type : Bearish
Timeframe : Openning
Here is a more detailed summary of the historical variations registered by ETHEREUM CLASSIC - ETC/USD:
New HIGH record (1st january)
Type : Bullish
Timeframe : Weekly
Technical
Technical analysis of this Weekly chart of ETHEREUM CLASSIC - ETC/USD indicates that the overall trend is strongly bearish. The signals given by moving averages are 92.86% bearish. This strong bearish trend is confirmed by the strong signals currently being given by short-term moving averages. The Central Indicators scanner does not detect any result on moving averages that would impact this trend.
An assessment of technical indicators does not currently provide any relevant information to suggest whether the signal given by the technical indicators is more bullish or bearish.
But beware of excesses. The Central Indicators scanner currently detects this:
CCI indicator is oversold : under -100
Type : Neutral
Timeframe : Weekly
Williams %R indicator is oversold : under -80
Type : Neutral
Timeframe : Weekly
Momentum indicator is back under 0
Type : Bearish
Timeframe : Weekly
Central Patterns, the market scanner focusing on chart patterns, resistances and supports found this result:
Near support of triangle
Type : Bullish
Timeframe : Weekly
The Central Candlesticks scanner currently notes the presence of this pattern in Japanese candlesticks that could mark the end of the short-term trend currently underway:
Doji
Type : Neutral
Timeframe : Weekly
| S1 | Price | R1 | R2 | R3 | |
|---|---|---|---|---|---|
| ProTrendLines | 14.78 | 15.45 | 24.12 | 49.61 | 74.96 |
| Change (%) | -4.34% | - | +56.12% | +221.10% | +385.18% |
| Change | -0.67 | - | +8.67 | +34.16 | +59.51 |
| Level | Major | - | Minor | Minor | Minor |
To determine price objectives, it is also possible to use the pivot points. Here is the price position in relation to pivot points:
| Pivot points | S3 | S2 | S1 | PP | R1 | R2 | R3 |
|---|---|---|---|---|---|---|---|
| Standard | 14.75 | 14.89 | 15.07 | 15.21 | 15.39 | 15.53 | 15.71 |
| Camarilla | 15.16 | 15.19 | 15.22 | 15.25 | 15.28 | 15.31 | 15.34 |
| Woodie | 14.77 | 14.90 | 15.09 | 15.22 | 15.41 | 15.54 | 15.73 |
| Fibonacci | 14.89 | 15.01 | 15.09 | 15.21 | 15.33 | 15.41 | 15.53 |
| Pivot points | S3 | S2 | S1 | PP | R1 | R2 | R3 |
|---|---|---|---|---|---|---|---|
| Standard | 14.60 | 14.87 | 15.13 | 15.40 | 15.66 | 15.93 | 16.19 |
| Camarilla | 15.24 | 15.29 | 15.34 | 15.39 | 15.44 | 15.49 | 15.54 |
| Woodie | 14.60 | 14.87 | 15.13 | 15.40 | 15.66 | 15.93 | 16.19 |
| Fibonacci | 14.87 | 15.07 | 15.20 | 15.40 | 15.60 | 15.73 | 15.93 |
| Pivot points | S3 | S2 | S1 | PP | R1 | R2 | R3 |
|---|---|---|---|---|---|---|---|
| Standard | 8.48 | 11.11 | 13.31 | 15.94 | 18.14 | 20.77 | 22.97 |
| Camarilla | 14.18 | 14.63 | 15.07 | 15.51 | 15.95 | 16.40 | 16.84 |
| Woodie | 8.27 | 11.00 | 13.10 | 15.83 | 17.93 | 20.66 | 22.76 |
| Fibonacci | 11.11 | 12.96 | 14.10 | 15.94 | 17.79 | 18.93 | 20.77 |
Numerical data
The following are the details of the technical indicators and moving averages that were collected to generate this technical analysis:
| RSI (14): | 39.39 | |
| MACD (12,26,9): | -1.2700 | |
| Directional Movement: | -6.10 | |
| AROON (14): | 21.43 | |
| DEMA (21): | 15.83 | |
| Parabolic SAR (0,02-0,02-0,2): | 21.54 | |
| Elder Ray (13): | -1.86 | |
| Super Trend (3,10): | 20.94 | |
| Zig ZAG (10): | 15.45 | |
| VORTEX (21): | 0.8900 | |
| Stochastique (14,3,5): | 21.43 | |
| TEMA (21): | 15.81 | |
| Williams %R (14): | -82.00 | |
| Chande Momentum Oscillator (20): | -2.90 | |
| Repulse (5,40,3): | -1.5400 | |
| ROCnROLL: | 2 | |
| TRIX (15,9): | -0.7800 | |
| Courbe Coppock: | 17.78 |
| MA7: | 15.15 | |
| MA20: | 15.49 | |
| MA50: | 16.47 | |
| MA100: | 17.22 | |
| MAexp7: | 16.14 | |
| MAexp20: | 17.49 | |
| MAexp50: | 20.26 | |
| MAexp100: | 23.08 | |
| Price / MA7: | +1.98% | |
| Price / MA20: | -0.26% | |
| Price / MA50: | -6.19% | |
| Price / MA100: | -10.28% | |
| Price / MAexp7: | -4.28% | |
| Price / MAexp20: | -11.66% | |
| Price / MAexp50: | -23.74% | |
| Price / MAexp100: | -33.06% |
About author

Online


Add a comment
Comments
0 comments on the analysis ETHEREUM CLASSIC - ETC/USD - Weekly