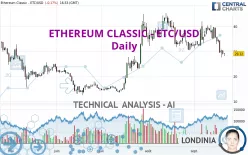
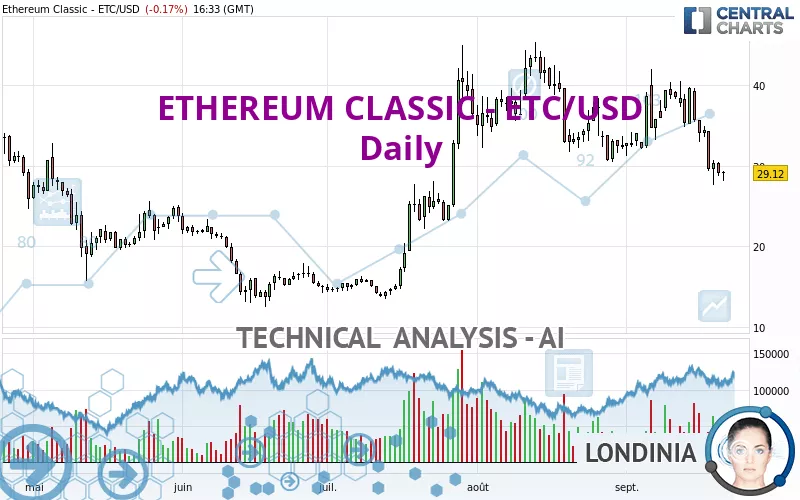
ETHEREUM CLASSIC - ETC/USD - Daily - Technical analysis published on 09/21/2022 (GMT)
- 190
- 0
Click here for a new analysis!
- Timeframe : Daily
- - Analysis generated on
- Status : TARGET REACHED
Summary of the analysis

Additional analysis
Quotes
The ETHEREUM CLASSIC - ETC/USD rating is 29.12 USD. The price registered a decrease of -0.17% on the session with the lowest point at 28.16 USD and the highest point at 29.42 USD. The deviation from the price is +3.41% for the low point and -1.02% for the high point.The Central Gaps scanner detects a bullish opening marking the presence of buyers ahead of sellers at the opening but not sufficiently marked to allow the price to register a quotation gap.
Bullish opening
Type : Bullish
Timeframe : Openning
So that you have an overall view of the price change, here is a table showing the variations over several periods:
Near a new LOW record (1 month)
Type : Bearish
Timeframe : Weekly
Technical
A technical analysis in Daily of this ETHEREUM CLASSIC - ETC/USD chart shows a slightly bearish trend. 60.71% of the signals given by moving averages are bearish. This slightly bearish trend could be reinforced by the strong bearish signals given by short-term moving averages. There is no crossing of moving average by the price or crossing of moving averages between themselves.
In fact, 13 technical indicators on 18 studied are currently bearish. Caution: the Central Indicators scanner currently detects an excess:
CCI indicator is oversold : under -100
Type : Neutral
Timeframe : Daily
Williams %R indicator is oversold : under -80
Type : Neutral
Timeframe : Daily
Pivot points : price is under support 1
Type : Neutral
Timeframe : Weekly
An analysis of the price chart with the Central Patterns scanner (detector of chart patterns and resistances and supports) shows a result that can have an impact on the price change:
Support of channel is broken
Type : Bearish
Timeframe : Daily
No result was found by the Central Candlesticks scanner on Japanese candlesticks.
| S3 | S2 | S1 | Price | R1 | R2 | R3 | |
|---|---|---|---|---|---|---|---|
| ProTrendLines | 13.71 | 19.09 | 24.31 | 29.12 | 32.18 | 35.71 | 39.64 |
| Change (%) | -52.92% | -34.44% | -16.52% | - | +10.51% | +22.63% | +36.13% |
| Change | -15.41 | -10.03 | -4.81 | - | +3.06 | +6.59 | +10.52 |
| Level | Intermediate | Minor | Major | - | Minor | Intermediate | Intermediate |
To determine price objectives, it is also possible to use the pivot points. Here is the price position in relation to pivot points:
| Pivot points | S3 | S2 | S1 | PP | R1 | R2 | R3 |
|---|---|---|---|---|---|---|---|
| Standard | 26.69 | 27.73 | 28.45 | 29.49 | 30.21 | 31.25 | 31.97 |
| Camarilla | 28.69 | 28.85 | 29.01 | 29.17 | 29.33 | 29.49 | 29.65 |
| Woodie | 26.53 | 27.65 | 28.29 | 29.41 | 30.05 | 31.17 | 31.81 |
| Fibonacci | 27.73 | 28.40 | 28.82 | 29.49 | 30.16 | 30.58 | 31.25 |
| Pivot points | S3 | S2 | S1 | PP | R1 | R2 | R3 |
|---|---|---|---|---|---|---|---|
| Standard | 23.89 | 28.42 | 31.43 | 35.96 | 38.97 | 43.50 | 46.51 |
| Camarilla | 32.37 | 33.06 | 33.75 | 34.44 | 35.13 | 35.82 | 36.51 |
| Woodie | 23.13 | 28.04 | 30.67 | 35.58 | 38.21 | 43.12 | 45.75 |
| Fibonacci | 28.42 | 31.30 | 33.08 | 35.96 | 38.84 | 40.62 | 43.50 |
| Pivot points | S3 | S2 | S1 | PP | R1 | R2 | R3 |
|---|---|---|---|---|---|---|---|
| Standard | 11.89 | 21.19 | 26.79 | 36.09 | 41.69 | 50.99 | 56.59 |
| Camarilla | 28.29 | 29.66 | 31.02 | 32.39 | 33.76 | 35.12 | 36.49 |
| Woodie | 10.04 | 20.27 | 24.94 | 35.17 | 39.84 | 50.07 | 54.74 |
| Fibonacci | 21.19 | 26.88 | 30.40 | 36.09 | 41.78 | 45.30 | 50.99 |
Numerical data
The following is the status of technical indicators and moving averages registered at the time this technical analysis was created:
| RSI (14): | 38.94 | |
| MACD (12,26,9): | -1.2500 | |
| Directional Movement: | -9.15 | |
| AROON (14): | -50.00 | |
| DEMA (21): | 32.63 | |
| Parabolic SAR (0,02-0,02-0,2): | 39.60 | |
| Elder Ray (13): | -4.24 | |
| Super Trend (3,10): | 37.66 | |
| Zig ZAG (10): | 28.97 | |
| VORTEX (21): | 0.9000 | |
| Stochastique (14,3,5): | 14.22 | |
| TEMA (21): | 30.94 | |
| Williams %R (14): | -88.22 | |
| Chande Momentum Oscillator (20): | -10.31 | |
| Repulse (5,40,3): | -6.3500 | |
| ROCnROLL: | 2 | |
| TRIX (15,9): | -0.1200 | |
| Courbe Coppock: | 19.44 |
| MA7: | 31.77 | |
| MA20: | 34.84 | |
| MA50: | 35.94 | |
| MA100: | 28.06 | |
| MAexp7: | 31.50 | |
| MAexp20: | 33.82 | |
| MAexp50: | 33.52 | |
| MAexp100: | 31.14 | |
| Price / MA7: | -8.34% | |
| Price / MA20: | -16.42% | |
| Price / MA50: | -18.98% | |
| Price / MA100: | +3.78% | |
| Price / MAexp7: | -7.56% | |
| Price / MAexp20: | -13.90% | |
| Price / MAexp50: | -13.13% | |
| Price / MAexp100: | -6.49% |
About author
Online


Add a comment
Comments
0 comments on the analysis ETHEREUM CLASSIC - ETC/USD - Daily