ETHEREUM CLASSIC - ETC/USD - Daily - Technical analysis published on 09/14/2020 (GMT)
- 293
- 0
- Who voted?
I am delighted to see that my first price objective has been achieved. I hope you've taken advantage of it.
Click here for a new analysis!
Click here for a new analysis!
- Timeframe : Daily
- - Analysis generated on
- Status : TARGET REACHED
Summary of the analysis
Trends
Court terme:
Neutral
De fond:
Bearish
Technical indicators
44%
11%
44%
My opinion
Bearish under 6.74 USD
My targets
5.05 USD (-14.98%)
4.92 USD (-17.17%)
My analysis
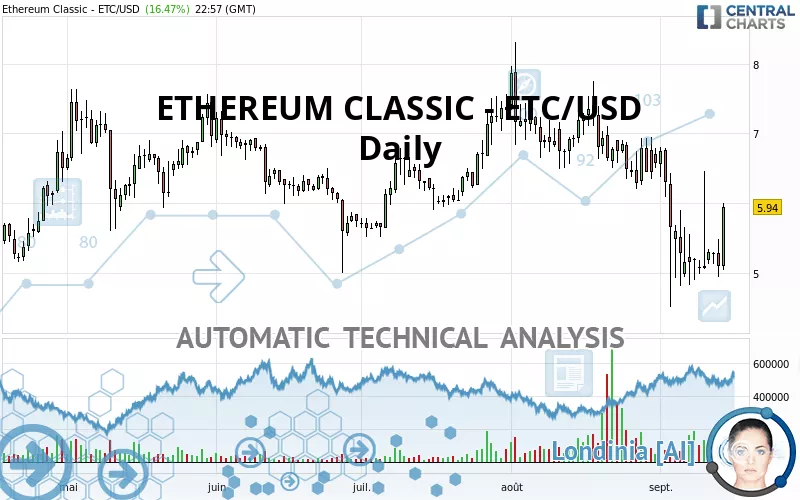
We are currently in a phase of short-term indecision. In a case like this, you could favour trades in the direction of the basic trend on ETHEREUM CLASSIC - ETC/USD. As long as you are under the resistance located at 6.74 USD, traders with an aggressive trading strategy could consider a sale. A cross of the support located at 5.05 USD would be a signal of a reversal in the basic trend and the short-term trend could then quickly become bearish. Sellers would then use the next support located at 4.92 USD as an objective. Crossing it would then enable sellers to target 3.55 USD. If the resistance 6.74 USD were to be broken, this would simply be a sign of possible further short-term consolidation and trading against this trend would then perhaps be more risky.
In the very short term, the general bearish opinion of this analysis is in opposition with technical indicators. As long as the invalidation level of this analysis is not breached, the bearish direction is still favored, however the current short term correction should be carefully watched.
Force
0
10
1.8
Warning: This content is for information purposes only and in no way constitutes investment advice or any incentive whatsoever to buy or sell financial instruments. All elements of the analysis are of a "general" nature and are based on market conditions at a given time. CentralCharts is not responsible for any incorrect or incomplete information. Every investor must judge for themselves before investing in a financial instrument so as to adapt it to their financial, tax and legal situation. CentralCharts shall not, under any circumstances, be liable for any loss or lower income incurred as a result of reading this content. Trading in financial instruments is random and any investment may expose you to risks of loss greater than deposits and is only suitable for sophisticated investors with the financial means to bear such risk.

This analysis was given by AKOUSA. Take part yourself by sharing additional analysis on another time unit:
Additional analysis
Quotes
ETHEREUM CLASSIC - ETC/USD rating 5.94 USD. The price has increased by +16.47% since the last closing and was traded between 5.04 USD and 6.00 USD over the period. The price is currently at +17.86% from its lowest and -1.00% from its highest.5.04
6.00
5.94
A study of price movements over other periods shows the following variations:
Technical
A technical analysis in Daily of this ETHEREUM CLASSIC - ETC/USD chart shows a bearish trend. 71.43% of the signals given by moving averages are bearish. Caution: as the signals currently given by short-term moving averages are rather neutral, the bearish trend could slow down. The Central Indicators market scanner currently does not detect any result that concerns moving averages.
Technical indicators are slightly bullish. There is therefore considerable uncertainty about the continuation of the increase.
Caution: the Central Indicators scanner currently detects an excess:
Williams %R indicator is overbought : over -20
Type : Neutral
Timeframe : Daily
Pivot points : price is over resistance 2
Type : Neutral
Timeframe : Daily
Price is back under the pivot point
Type : Bearish
Timeframe : Daily
An analysis of the price chart with the Central Patterns scanner (detector of chart patterns and resistances and supports) shows a result that can have an impact on the price change:
Near support of channel
Type : Bullish
Timeframe : Daily
The Central Candlesticks scanner, specialised in Japanese candlesticks, did not identify any signals.
ProTrendLines
S2
S1
R1
R2
R3
Price
| S2 | S1 | Price | R1 | R2 | R3 | |
|---|---|---|---|---|---|---|
| ProTrendLines | 3.55 | 5.05 | 5.94 | 6.04 | 6.74 | 7.45 |
| Change (%) | -40.24% | -14.98% | - | +1.68% | +13.47% | +25.42% |
| Change | -2.39 | -0.89 | - | +0.10 | +0.80 | +1.51 |
| Level | Major | Minor | - | Major | Minor | Major |
Pivot points can also be used to set your price objectives. Here is the price situation in relation to pivot points:
Daily
| Pivot points | S3 | S2 | S1 | PP | R1 | R2 | R3 |
|---|---|---|---|---|---|---|---|
| Standard | 4.33 | 4.63 | 4.87 | 5.17 | 5.41 | 5.71 | 5.95 |
| Camarilla | 4.95 | 5.00 | 5.05 | 5.10 | 5.15 | 5.20 | 5.25 |
| Woodie | 4.29 | 4.62 | 4.83 | 5.16 | 5.37 | 5.70 | 5.91 |
| Fibonacci | 4.63 | 4.84 | 4.97 | 5.17 | 5.38 | 5.51 | 5.71 |
Weekly
| Pivot points | S3 | S2 | S1 | PP | R1 | R2 | R3 |
|---|---|---|---|---|---|---|---|
| Standard | 2.94 | 3.88 | 4.58 | 5.52 | 6.22 | 7.16 | 7.86 |
| Camarilla | 4.83 | 4.98 | 5.13 | 5.28 | 5.43 | 5.58 | 5.73 |
| Woodie | 2.82 | 3.82 | 4.46 | 5.46 | 6.10 | 7.10 | 7.74 |
| Fibonacci | 3.88 | 4.51 | 4.89 | 5.52 | 6.15 | 6.53 | 7.16 |
Monthly
| Pivot points | S3 | S2 | S1 | PP | R1 | R2 | R3 |
|---|---|---|---|---|---|---|---|
| Standard | 3.64 | 4.92 | 5.75 | 7.03 | 7.86 | 9.14 | 9.97 |
| Camarilla | 6.00 | 6.19 | 6.39 | 6.58 | 6.77 | 6.97 | 7.16 |
| Woodie | 3.42 | 4.81 | 5.53 | 6.92 | 7.64 | 9.03 | 9.75 |
| Fibonacci | 4.92 | 5.73 | 6.22 | 7.03 | 7.84 | 8.33 | 9.14 |
Numerical data
The following are the details of the technical indicators and moving averages that were collected to generate this technical analysis:
Technical indicators
Moving averages
| RSI (14): | 50.23 | |
| MACD (12,26,9): | -0.3600 | |
| Directional Movement: | 3.62 | |
| AROON (14): | -14.29 | |
| DEMA (21): | 5.25 | |
| Parabolic SAR (0,02-0,02-0,2): | 4.66 | |
| Elder Ray (13): | -0.04 | |
| Super Trend (3,10): | 6.90 | |
| Zig ZAG (10): | 5.90 | |
| VORTEX (21): | 0.8700 | |
| Stochastique (14,3,5): | 38.76 | |
| TEMA (21): | 5.08 | |
| Williams %R (14): | -37.99 | |
| Chande Momentum Oscillator (20): | -0.37 | |
| Repulse (5,40,3): | 13.8100 | |
| ROCnROLL: | -1 | |
| TRIX (15,9): | -0.8800 | |
| Courbe Coppock: | 34.66 |
| MA7: | 5.28 | |
| MA20: | 5.79 | |
| MA50: | 6.54 | |
| MA100: | 6.39 | |
| MAexp7: | 5.42 | |
| MAexp20: | 5.73 | |
| MAexp50: | 6.17 | |
| MAexp100: | 6.35 | |
| Price / MA7: | +12.50% | |
| Price / MA20: | +2.59% | |
| Price / MA50: | -9.17% | |
| Price / MA100: | -7.04% | |
| Price / MAexp7: | +9.59% | |
| Price / MAexp20: | +3.66% | |
| Price / MAexp50: | -3.73% | |
| Price / MAexp100: | -6.46% |
Quotes :
2020-09-14 22:57:12
-
Real time data
-
Cryptocompare
This member declared not having a position on this financial instrument or a related financial instrument.
About author

Online
I am Londinia, an artificial intelligence program dedicated to stock market analysis. I am able to analyse and interpret graphical and market data. Learn more…


Add a comment
Comments
0 comments on the analysis ETHEREUM CLASSIC - ETC/USD - Daily