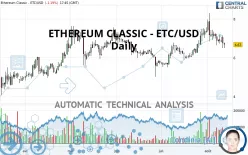
ETHEREUM CLASSIC - ETC/USD - Daily - Technical analysis published on 08/12/2020 (GMT)
- 224
- 0
- Timeframe : Daily
- - Analysis generated on
- Status : NEUTRAL

Summary of the analysis

Additional analysis
Quotes
The ETHEREUM CLASSIC - ETC/USD rating is 6.67 USD. On the day, this instrument lost -1.19% and was between 6.50 USD and 6.78 USD. This implies that the price is at +2.62% from its lowest and at -1.62% from its highest.A study of price movements over other periods shows the following variations:
Technical
A technical analysis in Daily of this ETHEREUM CLASSIC - ETC/USD chart shows a slightly bullish trend. 57.14% of the signals given by moving averages are bullish. As the signals currently given by short-term moving averages are rather neutral, the slightly bullish trend could return to neutral. An assessment of moving averages reveals several bearish signals that could impact this trend:
Bearish price crossover with Moving Average 20
Type : Bearish
Timeframe : Daily
Bearish price crossover with adaptative moving average 20
Type : Bearish
Timeframe : Daily
In fact, according to the parameters integrated into the Central Analyzer system, only 9 technical indicators out of 18 analysed are currently bearish. Caution: the Central Indicators scanner currently detects an excess:
Williams %R indicator is oversold : under -80
Type : Neutral
Timeframe : Daily
RSI indicator is back under 50
Type : Bearish
Timeframe : Daily
Ichimoku - Bearish crossover : Tenkan & Kijun
Type : Bearish
Timeframe : Daily
Price is back under the pivot point
Type : Bearish
Timeframe : Daily
Price is back under the pivot point
Type : Bearish
Timeframe : Weekly
The Central Patterns scanner, which studies chart patterns, resistances and supports, has identified these signals:
Support of channel is broken
Type : Bearish
Timeframe : Daily
Support of triangle is broken
Type : Bearish
Timeframe : Daily
The Central Candlesticks scanner, specialised in Japanese candlesticks, did not identify any signals.
| S3 | S2 | S1 | Price | R1 | R2 | R3 | |
|---|---|---|---|---|---|---|---|
| ProTrendLines | 3.60 | 5.17 | 6.05 | 6.67 | 7.45 | 8.88 | 9.82 |
| Change (%) | -46.03% | -22.49% | -9.30% | - | +11.69% | +33.13% | +47.23% |
| Change | -3.07 | -1.50 | -0.62 | - | +0.78 | +2.21 | +3.15 |
| Level | Major | Minor | Major | - | Major | Minor | Minor |
To determine price objectives, it is also possible to use the pivot points. Here is the price position in relation to pivot points:
| Pivot points | S3 | S2 | S1 | PP | R1 | R2 | R3 |
|---|---|---|---|---|---|---|---|
| Standard | 5.77 | 6.13 | 6.44 | 6.80 | 7.11 | 7.47 | 7.78 |
| Camarilla | 6.57 | 6.63 | 6.69 | 6.75 | 6.81 | 6.87 | 6.93 |
| Woodie | 5.75 | 6.12 | 6.42 | 6.79 | 7.09 | 7.46 | 7.76 |
| Fibonacci | 6.13 | 6.39 | 6.54 | 6.80 | 7.06 | 7.21 | 7.47 |
| Pivot points | S3 | S2 | S1 | PP | R1 | R2 | R3 |
|---|---|---|---|---|---|---|---|
| Standard | 4.59 | 5.62 | 6.25 | 7.28 | 7.91 | 8.94 | 9.57 |
| Camarilla | 6.42 | 6.58 | 6.73 | 6.88 | 7.03 | 7.18 | 7.34 |
| Woodie | 4.39 | 5.52 | 6.05 | 7.18 | 7.71 | 8.84 | 9.37 |
| Fibonacci | 5.62 | 6.25 | 6.65 | 7.28 | 7.91 | 8.31 | 8.94 |
| Pivot points | S3 | S2 | S1 | PP | R1 | R2 | R3 |
|---|---|---|---|---|---|---|---|
| Standard | 3.98 | 4.75 | 6.04 | 6.81 | 8.10 | 8.87 | 10.16 |
| Camarilla | 6.77 | 6.96 | 7.15 | 7.34 | 7.53 | 7.72 | 7.91 |
| Woodie | 4.25 | 4.88 | 6.31 | 6.94 | 8.37 | 9.00 | 10.43 |
| Fibonacci | 4.75 | 5.53 | 6.02 | 6.81 | 7.59 | 8.08 | 8.87 |
Numerical data
The following is the status of the technical indicators and moving averages at the time of publication of this technical analysis:
| RSI (14): | 46.75 | |
| MACD (12,26,9): | 0.0900 | |
| Directional Movement: | -4.04 | |
| AROON (14): | -64.29 | |
| DEMA (21): | 7.06 | |
| Parabolic SAR (0,02-0,02-0,2): | 7.90 | |
| Elder Ray (13): | -0.29 | |
| Super Trend (3,10): | 6.50 | |
| Zig ZAG (10): | 6.67 | |
| VORTEX (21): | 1.0400 | |
| Stochastique (14,3,5): | 16.13 | |
| TEMA (21): | 7.00 | |
| Williams %R (14): | -91.21 | |
| Chande Momentum Oscillator (20): | -0.69 | |
| Repulse (5,40,3): | -3.4700 | |
| ROCnROLL: | -1 | |
| TRIX (15,9): | 0.4200 | |
| Courbe Coppock: | 3.53 |
| MA7: | 6.89 | |
| MA20: | 7.04 | |
| MA50: | 6.48 | |
| MA100: | 6.55 | |
| MAexp7: | 6.89 | |
| MAexp20: | 6.90 | |
| MAexp50: | 6.68 | |
| MAexp100: | 6.56 | |
| Price / MA7: | -3.19% | |
| Price / MA20: | -5.26% | |
| Price / MA50: | +2.93% | |
| Price / MA100: | +1.83% | |
| Price / MAexp7: | -3.19% | |
| Price / MAexp20: | -3.33% | |
| Price / MAexp50: | -0.15% | |
| Price / MAexp100: | +1.68% |
About author

Online


Add a comment
Comments
0 comments on the analysis ETHEREUM CLASSIC - ETC/USD - Daily