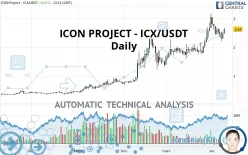
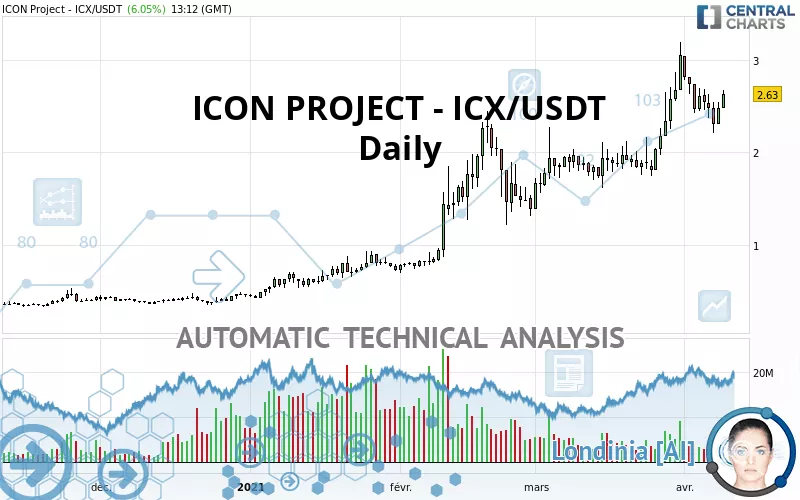
ICON - ICX/USDT - Daily - Technical analysis published on 04/09/2021 (GMT)
- 737
- 0
Click here for a new analysis!
- Timeframe : Daily
- - Analysis generated on
- Status : INVALID
Summary of the analysis

Additional analysis
Quotes
The ICON PROJECT - ICX/USDT price is 2.63 USDT. On the day, this instrument gained +6.05% and was traded between 2.48 USDT and 2.67 USDT over the period. The price is currently at +6.05% from its lowest and -1.50% from its highest.The Central Gaps scanner detects a bullish opening marking the presence of buyers ahead of sellers at the opening but not sufficiently marked to allow the price to register a quotation gap.
Bullish opening
Type : Bullish
Timeframe : Openning
So that you have an overall view of the price change, here is a table showing the variations over several periods:
Technical
Technical analysis of ICON PROJECT - ICX/USDT in Daily shows a strongly overall bullish trend. The signals given by the moving averages are 92.86% bullish. This strong bullish trend is confirmed by the strong signals currently being given by short-term moving averages. There is no crossing of moving average by the price or crossing of moving averages between themselves.
The technical indicators are bullish. There is still some doubt about the price increase.
Central Indicators, the detector scanner for these technical indicators has recently detected several signals:
Pivot points : price is over resistance 3
Type : Neutral
Timeframe : Daily
Pivot points : price is over resistance 3
Type : Neutral
Timeframe : Weekly
Pivot points : price is under support 1
Type : Neutral
Timeframe : Weekly
Pivot points : price is under support 3
Type : Neutral
Timeframe : Daily
Williams %R indicator is back over -50
Type : Bullish
Timeframe : Daily
No signals are given by Central Patterns, a market scanner specialised in chart patterns, resistances and supports.
No result was found by the Central Candlesticks scanner on Japanese candlesticks.
| S3 | S2 | S1 | Price | R1 | |
|---|---|---|---|---|---|
| ProTrendLines | 0.95 | 1.81 | 2.27 | 2.63 | 3.04 |
| Change (%) | -63.88% | -31.18% | -13.69% | - | +15.59% |
| Change | -1.68 | -0.82 | -0.36 | - | +0.41 |
| Level | Intermediate | Intermediate | Major | - | Intermediate |
Attention could also be paid to pivot points to set price objectives:
| Pivot points | S3 | S2 | S1 | PP | R1 | R2 | R3 |
|---|---|---|---|---|---|---|---|
| Standard | 2.10 | 2.20 | 2.34 | 2.44 | 2.58 | 2.68 | 2.82 |
| Camarilla | 2.41 | 2.44 | 2.46 | 2.48 | 2.50 | 2.52 | 2.55 |
| Woodie | 2.12 | 2.21 | 2.36 | 2.45 | 2.60 | 2.69 | 2.84 |
| Fibonacci | 2.20 | 2.29 | 2.35 | 2.44 | 2.53 | 2.59 | 2.68 |
| Pivot points | S3 | S2 | S1 | PP | R1 | R2 | R3 |
|---|---|---|---|---|---|---|---|
| Standard | 1.03 | 1.60 | 2.04 | 2.61 | 3.05 | 3.62 | 4.06 |
| Camarilla | 2.19 | 2.29 | 2.38 | 2.47 | 2.56 | 2.66 | 2.75 |
| Woodie | 0.96 | 1.57 | 1.97 | 2.58 | 2.98 | 3.59 | 3.99 |
| Fibonacci | 1.60 | 1.99 | 2.23 | 2.61 | 3.00 | 3.24 | 3.62 |
| Pivot points | S3 | S2 | S1 | PP | R1 | R2 | R3 |
|---|---|---|---|---|---|---|---|
| Standard | 0.10 | 0.74 | 1.90 | 2.54 | 3.70 | 4.34 | 5.50 |
| Camarilla | 2.56 | 2.72 | 2.89 | 3.05 | 3.22 | 3.38 | 3.55 |
| Woodie | 0.35 | 0.87 | 2.15 | 2.67 | 3.95 | 4.47 | 5.75 |
| Fibonacci | 0.74 | 1.43 | 1.86 | 2.54 | 3.23 | 3.66 | 4.34 |
Numerical data
The following are the details of the technical indicators and moving averages that were collected to generate this technical analysis:
| RSI (14): | 59.81 | |
| MACD (12,26,9): | 0.1800 | |
| Directional Movement: | 9.80 | |
| AROON (14): | 35.71 | |
| DEMA (21): | 2.63 | |
| Parabolic SAR (0,02-0,02-0,2): | 3.10 | |
| Elder Ray (13): | 0.09 | |
| Super Trend (3,10): | 2.02 | |
| Zig ZAG (10): | 2.63 | |
| VORTEX (21): | 1.1100 | |
| Stochastique (14,3,5): | 47.38 | |
| TEMA (21): | 2.64 | |
| Williams %R (14): | -46.19 | |
| Chande Momentum Oscillator (20): | 0.29 | |
| Repulse (5,40,3): | 6.6400 | |
| ROCnROLL: | 1 | |
| TRIX (15,9): | 1.3900 | |
| Courbe Coppock: | 53.83 |
| MA7: | 2.50 | |
| MA20: | 2.36 | |
| MA50: | 2.03 | |
| MA100: | 1.45 | |
| MAexp7: | 2.52 | |
| MAexp20: | 2.39 | |
| MAexp50: | 2.04 | |
| MAexp100: | 1.62 | |
| Price / MA7: | +5.20% | |
| Price / MA20: | +11.44% | |
| Price / MA50: | +29.56% | |
| Price / MA100: | +81.38% | |
| Price / MAexp7: | +4.37% | |
| Price / MAexp20: | +10.04% | |
| Price / MAexp50: | +28.92% | |
| Price / MAexp100: | +62.35% |
About author

Online


Add a comment
Comments
0 comments on the analysis ICON - ICX/USDT - Daily