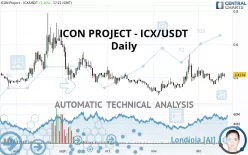
ICON - ICX/USDT - Daily - Technical analysis published on 12/18/2020 (GMT)
- 277
- 0
Click here for a new analysis!
- Timeframe : Daily
- - Analysis generated on
- Status : INVALID

Summary of the analysis

Additional analysis
Quotes
The ICON PROJECT - ICX/USDT rating is 0.417400 USDT. On the day, this instrument gained +2.20% with the lowest point at 0.401900 USDT and the highest point at 0.427100 USDT. The deviation from the price is +3.86% for the low point and -2.27% for the high point.The Central Gaps scanner detects a bullish opening marking the presence of buyers ahead of sellers at the opening but not sufficiently marked to allow the price to register a quotation gap.
Bullish opening
Type : Bullish
Timeframe : Openning
Here is a more detailed summary of the historical variations registered by ICON PROJECT - ICX/USDT:
Technical
Technical analysis of ICON PROJECT - ICX/USDT in Daily shows an overall bullish trend. 75.00% of the signals given by moving averages are bullish. The overall trend is reinforced by the strong bullish signals from short-term moving averages. The Central Indicators market scanner currently does not detect any result that concerns moving averages.
In fact, 12 technical indicators on 18 studied are currently bullish. Caution: the Central Indicators scanner currently detects an excess:
Williams %R indicator is overbought : over -20
Type : Neutral
Timeframe : Daily
Price is back under the pivot point
Type : Bearish
Timeframe : Daily
Price is back under the pivot point
Type : Bearish
Timeframe : Weekly
Momentum indicator is back under 0
Type : Bearish
Timeframe : Daily
Central Patterns, the market scanner focusing on chart patterns, resistances and supports found these results:
Near resistance of triangle
Type : Bearish
Timeframe : Daily
Near horizontal support
Type : Bullish
Timeframe : Daily
The Central Candlesticks scanner which studies Japanese candlesticks did not detect anything.
| S3 | S2 | S1 | Price | R1 | R2 | R3 | |
|---|---|---|---|---|---|---|---|
| ProTrendLines | 0.311740 | 0.370620 | 0.404117 | 0.417400 | 0.441100 | 0.506267 | 0.548400 |
| Change (%) | -25.31% | -11.21% | -3.18% | - | +5.68% | +21.29% | +31.38% |
| Change | -0.105660 | -0.046780 | -0.013283 | - | +0.023700 | +0.088867 | +0.131000 |
| Level | Intermediate | Major | Intermediate | - | Intermediate | Major | Minor |
Attention could also be paid to pivot points to set price objectives:
| Pivot points | S3 | S2 | S1 | PP | R1 | R2 | R3 |
|---|---|---|---|---|---|---|---|
| Standard | 0.377300 | 0.391800 | 0.400100 | 0.414600 | 0.422900 | 0.437400 | 0.445700 |
| Camarilla | 0.402130 | 0.404220 | 0.406310 | 0.408400 | 0.410490 | 0.412580 | 0.414670 |
| Woodie | 0.374200 | 0.390250 | 0.397000 | 0.413050 | 0.419800 | 0.435850 | 0.442600 |
| Fibonacci | 0.391800 | 0.400510 | 0.405890 | 0.414600 | 0.423310 | 0.428690 | 0.437400 |
| Pivot points | S3 | S2 | S1 | PP | R1 | R2 | R3 |
|---|---|---|---|---|---|---|---|
| Standard | 0.279767 | 0.318233 | 0.351067 | 0.389533 | 0.422367 | 0.460833 | 0.493667 |
| Camarilla | 0.364293 | 0.370828 | 0.377364 | 0.383900 | 0.390436 | 0.396972 | 0.403508 |
| Woodie | 0.276950 | 0.316825 | 0.348250 | 0.388125 | 0.419550 | 0.459425 | 0.490850 |
| Fibonacci | 0.318233 | 0.345470 | 0.362297 | 0.389533 | 0.416770 | 0.433597 | 0.460833 |
| Pivot points | S3 | S2 | S1 | PP | R1 | R2 | R3 |
|---|---|---|---|---|---|---|---|
| Standard | 0.062600 | 0.178000 | 0.309100 | 0.424500 | 0.555600 | 0.671000 | 0.802100 |
| Camarilla | 0.372413 | 0.395008 | 0.417604 | 0.440200 | 0.462796 | 0.485392 | 0.507988 |
| Woodie | 0.070450 | 0.181925 | 0.316950 | 0.428425 | 0.563450 | 0.674925 | 0.809950 |
| Fibonacci | 0.178000 | 0.272163 | 0.330337 | 0.424500 | 0.518663 | 0.576837 | 0.671000 |
Numerical data
The following is the status of technical indicators and moving averages registered at the time this technical analysis was created:
| RSI (14): | 53.20 | |
| MACD (12,26,9): | 0.0035 | |
| Directional Movement: | 2.968109 | |
| AROON (14): | -50.000000 | |
| DEMA (21): | 0.407467 | |
| Parabolic SAR (0,02-0,02-0,2): | 0.439330 | |
| Elder Ray (13): | 0.011006 | |
| Super Trend (3,10): | 0.466735 | |
| Zig ZAG (10): | 0.413900 | |
| VORTEX (21): | 1.0369 | |
| Stochastique (14,3,5): | 71.51 | |
| TEMA (21): | 0.405383 | |
| Williams %R (14): | -19.89 | |
| Chande Momentum Oscillator (20): | 0.000800 | |
| Repulse (5,40,3): | 1.1211 | |
| ROCnROLL: | 1 | |
| TRIX (15,9): | 0.1455 | |
| Courbe Coppock: | 8.78 |
| MA7: | 0.403114 | |
| MA20: | 0.407025 | |
| MA50: | 0.381288 | |
| MA100: | 0.395938 | |
| MAexp7: | 0.405894 | |
| MAexp20: | 0.401887 | |
| MAexp50: | 0.395613 | |
| MAexp100: | 0.396616 | |
| Price / MA7: | +3.54% | |
| Price / MA20: | +2.55% | |
| Price / MA50: | +9.47% | |
| Price / MA100: | +5.42% | |
| Price / MAexp7: | +2.83% | |
| Price / MAexp20: | +3.86% | |
| Price / MAexp50: | +5.51% | |
| Price / MAexp100: | +5.24% |
About author

Online


Add a comment
Comments
0 comments on the analysis ICON - ICX/USDT - Daily