BINANCE COIN - BNB/USDT - Weekly - Technical analysis published on 11/26/2022 (GMT)
- 184
- 0
- Timeframe : Weekly
- - Analysis generated on
- Status : NEUTRAL
Summary of the analysis

Additional analysis
Quotes
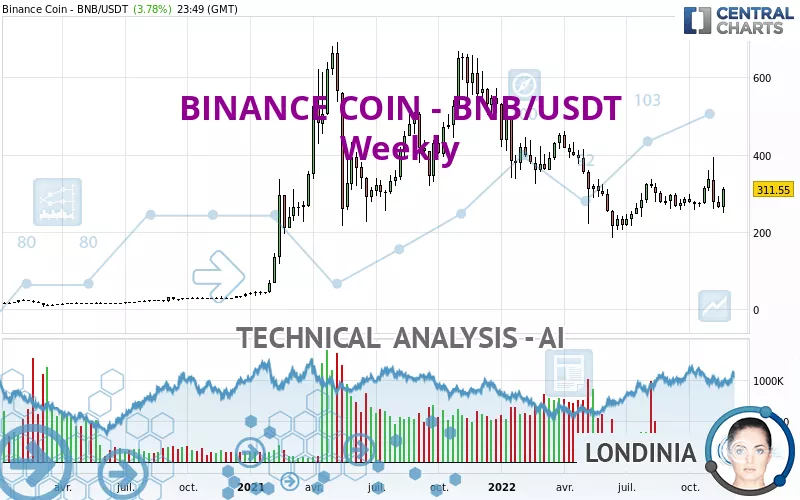
The BINANCE COIN - BNB/USDT price is 311.55 USDT. The price is up +17.88% over 5 days with the lowest point at 252.23 USDT and the highest point at 317.40 USDT. The deviation from the price is +23.52% for the low point and -1.84% for the high point.A bullish opening was detected by the Central Gaps scanner. Buyers are trying to impose a bullish momentum in the very short term.
Bullish opening
Type : Bullish
Timeframe : Openning
So that you have an overall view of the price change, here is a table showing the variations over several periods:
Technical
Technical analysis of this Weekly chart of BINANCE COIN - BNB/USDT indicates that the overall trend is not clearly defined. This indecision is confirmed by the neutral signals currently being given by short-term moving averages. The Central Indicators market scanner is currently detecting a bullish signal that could impact this trend:
Bullish price crossover with Moving Average 20
Type : Bullish
Timeframe : Weekly
The probability of a further increase is slight given the direction of the technical indicators.
Caution: the Central Indicators scanner currently detects an excess:
MACD indicator: bullish divergence
Type : Bullish
Timeframe : Weekly
Pivot points : price is over resistance 2
Type : Neutral
Timeframe : Weekly
RSI indicator is back over 50
Type : Bullish
Timeframe : Weekly
Momentum indicator is back over 0
Type : Bullish
Timeframe : Weekly
The analysis of the price chart with Central Patterns scanners does not return any result.
Central Candlesticks, the scanner specialised in Japanese candlesticks, detects a bullish signal that could support the hypothesis of a small rebound in the very short term:
Bullish engulfing lines
Type : Bullish
Timeframe : Weekly
| S3 | S2 | S1 | Price | R1 | R2 | R3 | |
|---|---|---|---|---|---|---|---|
| ProTrendLines | 29.23 | 197.19 | 263.03 | 311.55 | 329.65 | 450.23 | 676.15 |
| Change (%) | -90.62% | -36.71% | -15.57% | - | +5.81% | +44.51% | +117.03% |
| Change | -282.32 | -114.36 | -48.52 | - | +18.10 | +138.68 | +364.60 |
| Level | Minor | Major | Major | - | Intermediate | Minor | Major |
Pivot points can also be used to set your price objectives. Here is the price situation in relation to pivot points:
| Pivot points | S3 | S2 | S1 | PP | R1 | R2 | R3 |
|---|---|---|---|---|---|---|---|
| Standard | 283.27 | 288.63 | 294.42 | 299.78 | 305.57 | 310.93 | 316.72 |
| Camarilla | 297.13 | 298.16 | 299.18 | 300.20 | 301.22 | 302.24 | 303.27 |
| Woodie | 283.48 | 288.74 | 294.63 | 299.89 | 305.78 | 311.04 | 316.93 |
| Fibonacci | 288.63 | 292.89 | 295.52 | 299.78 | 304.04 | 306.67 | 310.93 |
| Pivot points | S3 | S2 | S1 | PP | R1 | R2 | R3 |
|---|---|---|---|---|---|---|---|
| Standard | 231.31 | 247.29 | 259.91 | 275.89 | 288.51 | 304.49 | 317.11 |
| Camarilla | 264.68 | 267.30 | 269.92 | 272.54 | 275.16 | 277.78 | 280.41 |
| Woodie | 229.64 | 246.45 | 258.24 | 275.05 | 286.84 | 303.65 | 315.44 |
| Fibonacci | 247.29 | 258.21 | 264.96 | 275.89 | 286.81 | 293.56 | 304.49 |
| Pivot points | S3 | S2 | S1 | PP | R1 | R2 | R3 |
|---|---|---|---|---|---|---|---|
| Standard | 196.42 | 226.96 | 276.37 | 306.91 | 356.32 | 386.86 | 436.27 |
| Camarilla | 303.80 | 311.13 | 318.46 | 325.79 | 333.12 | 340.45 | 347.78 |
| Woodie | 205.87 | 231.68 | 285.82 | 311.63 | 365.77 | 391.58 | 445.72 |
| Fibonacci | 226.96 | 257.50 | 276.37 | 306.91 | 337.45 | 356.32 | 386.86 |
Numerical data
The following is the status of the technical indicators and moving averages at the time of publication of this technical analysis:
| RSI (14): | 51.56 | |
| MACD (12,26,9): | -9.1900 | |
| Directional Movement: | 1.25 | |
| AROON (14): | -14.29 | |
| DEMA (21): | 276.48 | |
| Parabolic SAR (0,02-0,02-0,2): | 394.57 | |
| Elder Ray (13): | -6.75 | |
| Super Trend (3,10): | 372.16 | |
| Zig ZAG (10): | 310.64 | |
| VORTEX (21): | 1.0500 | |
| Stochastique (14,3,5): | 20.68 | |
| TEMA (21): | 290.30 | |
| Williams %R (14): | -57.72 | |
| Chande Momentum Oscillator (20): | 32.18 | |
| Repulse (5,40,3): | 3.5200 | |
| ROCnROLL: | -1 | |
| TRIX (15,9): | -0.7700 | |
| Courbe Coppock: | 6.44 |
| MA7: | 284.92 | |
| MA20: | 286.05 | |
| MA50: | 289.39 | |
| MA100: | 285.67 | |
| MAexp7: | 292.61 | |
| MAexp20: | 293.70 | |
| MAexp50: | 319.23 | |
| MAexp100: | 300.90 | |
| Price / MA7: | +9.35% | |
| Price / MA20: | +8.91% | |
| Price / MA50: | +7.66% | |
| Price / MA100: | +9.06% | |
| Price / MAexp7: | +6.47% | |
| Price / MAexp20: | +6.08% | |
| Price / MAexp50: | -2.41% | |
| Price / MAexp100: | +3.54% |
About author

Online


Add a comment
Comments
0 comments on the analysis BINANCE COIN - BNB/USDT - Weekly