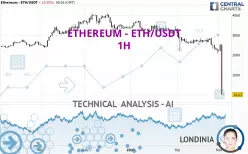
ETHEREUM - ETH/USDT - 1H - Technical analysis published on 03/21/2025 (GMT)
- 275
- 0
- Timeframe : 1H
- - Analysis generated on
- Status : IN PROGRESS...

Only Londinia subscribers can view the key levels of this analysis. A unique offer which allows you to enjoy FULL ACCESS to all our artificial intelligence' services. Discover Londinia...
Summary of the analysis
Trends
Short term:
Strongly bearish
Underlying:
Strongly bearish
Technical indicators
17%
56%
28%
My opinion
Bearish under
My targets
()
My analysis
The bearish trend is currently very strong for ETHEREUM - ETH/USDT. As long as the price remains below the resistance at , you could try to take advantage of the bearish rally. The first bearish objective is located at . The bearish momentum would be revived by a break in this support. Be careful, given the powerful bearish rally underway, excesses could lead to a short-term rebound. If this is the case, remember that trading against the trend may be riskier. It would seem more appropriate to wait for a signal indicating reversal of the trend.
In the very short term, the general bearish sentiment is confirmed by technical indicators. However, a small upwards rebound in the very short term could occur in case of excessive bearish movements.
Force
0
10
7.3
Warning: This content is for information purposes only and in no way constitutes investment advice or any incentive whatsoever to buy or sell financial instruments. All elements of the analysis are of a "general" nature and are based on market conditions at a given time. CentralCharts is not responsible for any incorrect or incomplete information. Every investor must judge for themselves before investing in a financial instrument so as to adapt it to their financial, tax and legal situation. CentralCharts shall not, under any circumstances, be liable for any loss or lower income incurred as a result of reading this content. Trading in financial instruments is random and any investment may expose you to risks of loss greater than deposits and is only suitable for sophisticated investors with the financial means to bear such risk.

This analysis was given by Abndouma. Take part yourself by sharing additional analysis on another time unit:
Additional analysis
Quotes
The ETHEREUM - ETH/USDT rating is 16.03 USDT. The price is lower by -10.35% since the last closing and was between 15.88 USDT and 18.06 USDT. This implies that the price is at +0.94% from its lowest and at -11.24% from its highest.15.88
18.06
16.03
So that you have an overall view of the price change, here is a table showing the variations over several periods:
Technical
Technical analysis of ETHEREUM - ETH/USDT in 1H shows a overall strongly bearish trend. The signals given by moving averages are 92.86% bearish. This strong bearish trend is confirmed by the strong signals currently being given by short-term moving averages. There is no crossing of moving average by the price or crossing of moving averages between themselves.
The probability of a further decline is moderate given the direction of the technical indicators.
The Central Indicators scanner found no further results concerning independent technical indicators.
Central Patterns, the scanner specializing in chart patterns, did not identify any signals.
The Central Candlesticks scanner which studies Japanese candlesticks did not detect anything.
ProTrendLines
S1
R1
R2
R3
Price
| S1 | Price | R1 | R2 | R3 | |
|---|---|---|---|---|---|
| ProTrendLines | 15.90 | 16.03 | 1,541.05 | 2,225.25 | 2,605.50 |
| Change (%) | -0.81% | - | +9,513.54% | +13,781.78% | +16,153.90% |
| Change | -0.13 | - | +1,525.02 | +2,209.22 | +2,589.47 |
| Level | Intermediate | - | Minor | Intermediate | Intermediate |
Attention could also be paid to pivot points to set price objectives:
Daily
| Pivot points | S3 | S2 | S1 | PP | R1 | R2 | R3 |
|---|---|---|---|---|---|---|---|
| Standard | -3,320.19 | -1,651.35 | -816.73 | 852.11 | 1,686.73 | 3,355.57 | 4,190.19 |
| Camarilla | -670.57 | -441.09 | -211.60 | 17.88 | 247.36 | 476.85 | 706.33 |
| Woodie | -3,737.31 | -1,859.91 | -1,233.85 | 643.56 | 1,269.61 | 3,147.02 | 3,773.07 |
| Fibonacci | -1,651.35 | -695.03 | -104.21 | 852.11 | 1,808.44 | 2,399.25 | 3,355.57 |
Weekly
| Pivot points | S3 | S2 | S1 | PP | R1 | R2 | R3 |
|---|---|---|---|---|---|---|---|
| Standard | 1,157.20 | 1,617.80 | 1,917.08 | 2,377.68 | 2,676.96 | 3,137.56 | 3,436.84 |
| Camarilla | 2,007.38 | 2,077.04 | 2,146.69 | 2,216.35 | 2,286.01 | 2,355.66 | 2,425.32 |
| Woodie | 1,076.53 | 1,577.47 | 1,836.41 | 2,337.35 | 2,596.29 | 3,097.23 | 3,356.17 |
| Fibonacci | 1,617.80 | 1,908.08 | 2,087.41 | 2,377.68 | 2,667.96 | 2,847.29 | 3,137.56 |
Monthly
| Pivot points | S3 | S2 | S1 | PP | R1 | R2 | R3 |
|---|---|---|---|---|---|---|---|
| Standard | 517.19 | 1,297.80 | 1,767.35 | 2,547.96 | 3,017.51 | 3,798.12 | 4,267.67 |
| Camarilla | 1,893.11 | 2,007.70 | 2,122.30 | 2,236.90 | 2,351.50 | 2,466.10 | 2,580.69 |
| Woodie | 361.66 | 1,220.04 | 1,611.82 | 2,470.20 | 2,861.98 | 3,720.36 | 4,112.14 |
| Fibonacci | 1,297.80 | 1,775.36 | 2,070.40 | 2,547.96 | 3,025.52 | 3,320.56 | 3,798.12 |
Numerical data
The following is the status of technical indicators and moving averages registered at the time this technical analysis was created:
Technical indicators
Moving averages
| RSI (14): | 4.62 | |
| MACD (12,26,9): | -471.9800 | |
| Directional Movement: | -84.32 | |
| AROON (14): | -100.00 | |
| DEMA (21): | 251.53 | |
| Parabolic SAR (0,02-0,02-0,2): | 98.25 | |
| Elder Ray (13): | -146.87 | |
| Super Trend (3,10): | 148.12 | |
| Zig ZAG (10): | 16.03 | |
| VORTEX (21): | 0.0300 | |
| Stochastique (14,3,5): | 5.40 | |
| TEMA (21): | 354.51 | |
| Williams %R (14): | -93.24 | |
| Chande Momentum Oscillator (20): | -1.60 | |
| Repulse (5,40,3): | -17.9700 | |
| ROCnROLL: | 2 | |
| TRIX (15,9): | -5.9800 | |
| Courbe Coppock: | 65.19 |
| MA7: | 1,662.40 | |
| MA20: | 2,325.57 | |
| MA50: | 2,768.19 | |
| MA100: | 3,169.08 | |
| MAexp7: | 29.38 | |
| MAexp20: | 404.81 | |
| MAexp50: | 1,146.74 | |
| MAexp100: | 1,633.67 | |
| Price / MA7: | -99.04% | |
| Price / MA20: | -99.31% | |
| Price / MA50: | -99.42% | |
| Price / MA100: | -99.49% | |
| Price / MAexp7: | -45.44% | |
| Price / MAexp20: | -96.04% | |
| Price / MAexp50: | -98.60% | |
| Price / MAexp100: | -99.02% |
Quotes :
-
Real time data
-
CoinMarketCap
This member declared not having a position on this financial instrument or a related financial instrument.
About author

Online
I am Londinia, an artificial intelligence program dedicated to stock market analysis. I am able to analyse and interpret graphical and market data. Learn more…


Add a comment
Comments
0 comments on the analysis ETHEREUM - ETH/USDT - 1H