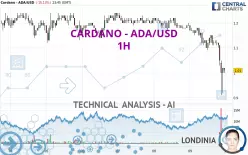
CARDANO - ADA/USD - 1H - Technical analysis published on 12/09/2024 (GMT)
- 172
- 0
Click here for a new analysis!
- Timeframe : 1H
- - Analysis generated on
- Status : TARGET REACHED

Summary of the analysis

Additional analysis
Quotes
The CARDANO - ADA/USD price is 1.01 USD. The price registered a decrease of -15.13% on the session and was between 0.91 USD and 1.19 USD. This implies that the price is at +10.99% from its lowest and at -15.13% from its highest.So that you have an overall view of the price change, here is a table showing the variations over several periods:
New LOW record (1st january)
Type : Bearish
Timeframe : Weekly
The Central Volumes scanner notes the presence of abnormal volumes:
Abnormal volumes
Timeframe : 5 days
Abnormal volumes
Timeframe : 20 days
Abnormal volumes
Timeframe : 50 days
Technical
Technical analysis of this 1H chart of CARDANO - ADA/USD indicates that the overall trend is strongly bearish. The signals given by moving averages are 92.86% bearish. This strong bearish trend is confirmed by the strong signals currently being given by short-term moving averages. The Central Indicators scanner does not detect any result on moving averages that would impact this trend.
An assessment of technical indicators does not currently provide any relevant information on the direction of future price movements.
But beware of excesses. The Central Indicators scanner currently detects this:
RSI indicator is oversold : under 30
Type : Neutral
Timeframe : 1 hour
CCI indicator is oversold : under -100
Type : Neutral
Timeframe : 1 hour
Williams %R indicator is oversold : under -80
Type : Neutral
Timeframe : 1 hour
Pivot points : price is under support 1
Type : Neutral
Timeframe : Weekly
Pivot points : price is under support 3
Type : Neutral
Timeframe : 1 hour
No signals are given by Central Patterns, a market scanner specialised in chart patterns, resistances and supports.
The Central Candlesticks scanner, specialised in Japanese candlesticks, did not identify any signals.
| S3 | S2 | S1 | Price | R1 | R2 | R3 | |
|---|---|---|---|---|---|---|---|
| ProTrendLines | 0.57 | 0.77 | 0.94 | 1.01 | 1.04 | 1.07 | 1.10 |
| Change (%) | -43.56% | -23.76% | -6.93% | - | +2.97% | +5.94% | +8.91% |
| Change | -0.44 | -0.24 | -0.07 | - | +0.03 | +0.06 | +0.09 |
| Level | Minor | Major | Minor | - | Intermediate | Minor | Minor |
Pivot points can also be used to set your price objectives. Here is the price situation in relation to pivot points:
| Pivot points | S3 | S2 | S1 | PP | R1 | R2 | R3 |
|---|---|---|---|---|---|---|---|
| Standard | 1.12 | 1.14 | 1.17 | 1.19 | 1.22 | 1.24 | 1.27 |
| Camarilla | 1.18 | 1.18 | 1.19 | 1.19 | 1.20 | 1.20 | 1.20 |
| Woodie | 1.12 | 1.14 | 1.17 | 1.19 | 1.22 | 1.24 | 1.27 |
| Fibonacci | 1.14 | 1.16 | 1.17 | 1.19 | 1.21 | 1.22 | 1.24 |
| Pivot points | S3 | S2 | S1 | PP | R1 | R2 | R3 |
|---|---|---|---|---|---|---|---|
| Standard | 0.77 | 0.90 | 1.06 | 1.19 | 1.35 | 1.48 | 1.64 |
| Camarilla | 1.13 | 1.16 | 1.18 | 1.21 | 1.24 | 1.26 | 1.29 |
| Woodie | 0.78 | 0.91 | 1.07 | 1.20 | 1.36 | 1.49 | 1.65 |
| Fibonacci | 0.90 | 1.01 | 1.08 | 1.19 | 1.30 | 1.37 | 1.48 |
| Pivot points | S3 | S2 | S1 | PP | R1 | R2 | R3 |
|---|---|---|---|---|---|---|---|
| Standard | -0.28 | 0.02 | 0.55 | 0.85 | 1.38 | 1.68 | 2.21 |
| Camarilla | 0.85 | 0.93 | 1.00 | 1.08 | 1.16 | 1.23 | 1.31 |
| Woodie | -0.17 | 0.08 | 0.67 | 0.91 | 1.50 | 1.74 | 2.33 |
| Fibonacci | 0.02 | 0.34 | 0.53 | 0.85 | 1.17 | 1.36 | 1.68 |
Numerical data
The following are the details of the technical indicators and moving averages that were collected to generate this technical analysis:
| RSI (14): | 24.70 | |
| MACD (12,26,9): | -0.0400 | |
| Directional Movement: | -38.79 | |
| AROON (14): | -50.00 | |
| DEMA (21): | 1.05 | |
| Parabolic SAR (0,02-0,02-0,2): | 1.13 | |
| Elder Ray (13): | -0.07 | |
| Super Trend (3,10): | 1.09 | |
| Zig ZAG (10): | 1.01 | |
| VORTEX (21): | 0.7700 | |
| Stochastique (14,3,5): | 40.07 | |
| TEMA (21): | 1.03 | |
| Williams %R (14): | -61.49 | |
| Chande Momentum Oscillator (20): | -0.09 | |
| Repulse (5,40,3): | 1.7500 | |
| ROCnROLL: | 2 | |
| TRIX (15,9): | -0.3300 | |
| Courbe Coppock: | 14.99 |
| MA7: | 1.17 | |
| MA20: | 1.07 | |
| MA50: | 0.70 | |
| MA100: | 0.53 | |
| MAexp7: | 1.05 | |
| MAexp20: | 1.10 | |
| MAexp50: | 1.14 | |
| MAexp100: | 1.16 | |
| Price / MA7: | -13.68% | |
| Price / MA20: | -5.61% | |
| Price / MA50: | +44.29% | |
| Price / MA100: | +90.57% | |
| Price / MAexp7: | -3.81% | |
| Price / MAexp20: | -8.18% | |
| Price / MAexp50: | -11.40% | |
| Price / MAexp100: | -12.93% |
About author

Online


Add a comment
Comments
0 comments on the analysis CARDANO - ADA/USD - 1H