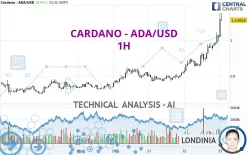
CARDANO - ADA/USD - 1H - Technical analysis published on 11/23/2024 (GMT)
- 256
- 0
Click here for a new analysis!
- Timeframe : 1H
- - Analysis generated on
- Status : LEVEL MAINTAINED

Summary of the analysis

Additional analysis
Quotes
The CARDANO - ADA/USD rating is 1.114519 USD. The price registered an increase of +9.41% on the session and was between 1.017599 USD and 1.154048 USD. This implies that the price is at +9.52% from its lowest and at -3.43% from its highest.The Central Gaps scanner detects a bullish opening marking the presence of buyers ahead of sellers at the opening but not sufficiently marked to allow the price to register a quotation gap.
Bullish opening
Type : Bullish
Timeframe : Openning
A study of price movements over other periods shows the following variations:
New HIGH record (1 year)
Type : Bullish
Timeframe : Weekly
New HIGH record (1st january)
Type : Bullish
Timeframe : Weekly
New HIGH record (1 month)
Type : Bullish
Timeframe : Weekly
The Central Volumes scanner detects abnormal volumes on the asset:
Abnormal volumes
Timeframe : 5 days
Abnormal volumes
Timeframe : 20 days
Technical
Technical analysis of this 1H chart of CARDANO - ADA/USD indicates that the overall trend is strongly bullish. 92.86% of the signals given by moving averages are bullish. This strongly bullish trend is supported by the strong bullish signals given by short-term moving averages. The Central Indicators market scanner currently does not detect any result that concerns moving averages.
An assessment of technical indicators shows a strong bullish signal.
But beware of excesses. The Central Indicators scanner currently detects this:
RSI indicator is overbought : over 80
Type : Neutral
Timeframe : 1 hour
CCI indicator is overbought : over 100
Type : Neutral
Timeframe : 1 hour
Previous candle closed over Bollinger bands
Type : Neutral
Timeframe : 1 hour
CCI indicator: bearish divergence
Type : Bearish
Timeframe : 1 hour
Williams %R indicator is overbought : over -20
Type : Neutral
Timeframe : 1 hour
Pivot points : price is over resistance 1
Type : Neutral
Timeframe : 1 hour
Pivot points : price is over resistance 2
Type : Neutral
Timeframe : Weekly
No signals are given by Central Patterns, a market scanner specialised in chart patterns, resistances and supports.
No result was found by the Central Candlesticks scanner on Japanese candlesticks.
| S3 | S2 | S1 | Price | R1 | |
|---|---|---|---|---|---|
| ProTrendLines | 0.776314 | 0.818556 | 0.848188 | 1.114519 | 1.208660 |
| Change (%) | -30.35% | -26.56% | -23.90% | - | +8.45% |
| Change | -0.338205 | -0.295963 | -0.266331 | - | +0.094141 |
| Level | Major | Minor | Intermediate | - | Minor |
Pivot points can also be used to set your price objectives. Here is the price situation in relation to pivot points:
| Pivot points | S3 | S2 | S1 | PP | R1 | R2 | R3 |
|---|---|---|---|---|---|---|---|
| Standard | 0.640959 | 0.727233 | 0.872964 | 0.959238 | 1.104969 | 1.191243 | 1.336974 |
| Camarilla | 0.954894 | 0.976161 | 0.997428 | 1.018695 | 1.039962 | 1.061229 | 1.082496 |
| Woodie | 0.670688 | 0.742097 | 0.902693 | 0.974102 | 1.134698 | 1.206107 | 1.366703 |
| Fibonacci | 0.727233 | 0.815859 | 0.870612 | 0.959238 | 1.047864 | 1.102617 | 1.191243 |
| Pivot points | S3 | S2 | S1 | PP | R1 | R2 | R3 |
|---|---|---|---|---|---|---|---|
| Standard | 0.226340 | 0.359910 | 0.550956 | 0.684526 | 0.875572 | 1.009142 | 1.200188 |
| Camarilla | 0.652734 | 0.682490 | 0.712247 | 0.742003 | 0.771760 | 0.801516 | 0.831272 |
| Woodie | 0.255079 | 0.374279 | 0.579695 | 0.698895 | 0.904311 | 1.023511 | 1.228927 |
| Fibonacci | 0.359910 | 0.483913 | 0.560522 | 0.684526 | 0.808529 | 0.885138 | 1.009142 |
| Pivot points | S3 | S2 | S1 | PP | R1 | R2 | R3 |
|---|---|---|---|---|---|---|---|
| Standard | 0.174594 | 0.244941 | 0.293147 | 0.363494 | 0.411700 | 0.482047 | 0.530253 |
| Camarilla | 0.308752 | 0.319619 | 0.330487 | 0.341354 | 0.352221 | 0.363089 | 0.373956 |
| Woodie | 0.163525 | 0.239406 | 0.282078 | 0.357959 | 0.400631 | 0.476512 | 0.519184 |
| Fibonacci | 0.244941 | 0.290228 | 0.318206 | 0.363494 | 0.408781 | 0.436759 | 0.482047 |
Numerical data
The following are the details of the technical indicators and moving averages that were collected to generate this technical analysis:
| RSI (14): | 82.42 | |
| MACD (12,26,9): | 0.0599 | |
| Directional Movement: | 50.150209 | |
| AROON (14): | 85.714286 | |
| DEMA (21): | 1.047770 | |
| Parabolic SAR (0,02-0,02-0,2): | 1.004966 | |
| Elder Ray (13): | 0.105996 | |
| Super Trend (3,10): | 1.005120 | |
| Zig ZAG (10): | 1.113886 | |
| VORTEX (21): | 1.3301 | |
| Stochastique (14,3,5): | 86.83 | |
| TEMA (21): | 1.081676 | |
| Williams %R (14): | -10.71 | |
| Chande Momentum Oscillator (20): | 0.226063 | |
| Repulse (5,40,3): | 9.0269 | |
| ROCnROLL: | 1 | |
| TRIX (15,9): | 0.7582 | |
| Courbe Coppock: | 33.77 |
| MA7: | 0.849015 | |
| MA20: | 0.634398 | |
| MA50: | 0.463318 | |
| MA100: | 0.408660 | |
| MAexp7: | 1.051262 | |
| MAexp20: | 0.974839 | |
| MAexp50: | 0.899197 | |
| MAexp100: | 0.840819 | |
| Price / MA7: | +31.27% | |
| Price / MA20: | +75.68% | |
| Price / MA50: | +140.55% | |
| Price / MA100: | +172.73% | |
| Price / MAexp7: | +6.02% | |
| Price / MAexp20: | +14.33% | |
| Price / MAexp50: | +23.95% | |
| Price / MAexp100: | +32.55% |
About author

Online


Add a comment
Comments
0 comments on the analysis CARDANO - ADA/USD - 1H