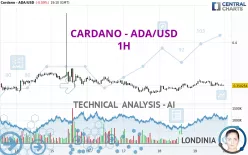
CARDANO - ADA/USD - 1H - Technical analysis published on 10/19/2024 (GMT)
- 166
- 0
- Timeframe : 1H
- - Analysis generated on
- Status : NEUTRAL

Summary of the analysis

Additional analysis
Quotes
CARDANO - ADA/USD rating 0.350254 USD. The price registered a decrease of -0.09% on the session and was traded between 0.349435 USD and 0.357199 USD over the period. The price is currently at +0.23% from its lowest and -1.94% from its highest.The Central Gaps scanner detects a bearish opening. A small advantage for sellers in the very short term.
Bearish opening
Type : Bearish
Timeframe : Openning
A study of price movements over other periods shows the following variations:
New HIGH record (1st january)
Type : Bullish
Timeframe : Weekly
Technical
Technical analysis of this 1H chart of CARDANO - ADA/USD indicates that the overall trend is slightly bearish. 60.71% of the signals given by moving averages are bearish. As the signals currently given by short-term moving averages are rather neutral, the slightly bearish trend could return to neutral. An assessment of moving averages reveals several bearish signals that could impact this trend:
Bearish price crossover with Moving Average 100
Type : Bearish
Timeframe : 1 hour
Bearish price crossover with adaptative moving average 50
Type : Bearish
Timeframe : 1 hour
In fact, 10 technical indicators on 18 studied are currently bearish. But beware of excesses. The Central Indicators scanner currently detects this:
CCI indicator is oversold : under -100
Type : Neutral
Timeframe : 1 hour
Williams %R indicator is oversold : under -80
Type : Neutral
Timeframe : 1 hour
Price is back over the pivot point
Type : Bullish
Timeframe : 1 hour
No signals are given by Central Patterns, a market scanner specialised in chart patterns, resistances and supports.
No result was found by the Central Candlesticks scanner on Japanese candlesticks.
| S3 | S2 | S1 | Price | R1 | R2 | R3 | |
|---|---|---|---|---|---|---|---|
| ProTrendLines | 0.242964 | 0.313632 | 0.339028 | 0.350254 | 0.350908 | 0.360148 | 0.393810 |
| Change (%) | -30.63% | -10.46% | -3.21% | - | +0.19% | +2.82% | +12.44% |
| Change | -0.107290 | -0.036622 | -0.011226 | - | +0.000654 | +0.009894 | +0.043556 |
| Level | Intermediate | Major | Intermediate | - | Intermediate | Intermediate | Minor |
Pivot points can also be used to set your price objectives. Here is the price situation in relation to pivot points:
| Pivot points | S3 | S2 | S1 | PP | R1 | R2 | R3 |
|---|---|---|---|---|---|---|---|
| Standard | 0.333385 | 0.337754 | 0.344180 | 0.348549 | 0.354975 | 0.359344 | 0.365770 |
| Camarilla | 0.347638 | 0.348628 | 0.349618 | 0.350607 | 0.351597 | 0.352586 | 0.353576 |
| Woodie | 0.334415 | 0.338268 | 0.345210 | 0.349063 | 0.356005 | 0.359858 | 0.366800 |
| Fibonacci | 0.337754 | 0.341877 | 0.344425 | 0.348549 | 0.352672 | 0.355220 | 0.359344 |
| Pivot points | S3 | S2 | S1 | PP | R1 | R2 | R3 |
|---|---|---|---|---|---|---|---|
| Standard | 0.296112 | 0.313590 | 0.333321 | 0.350799 | 0.370530 | 0.388008 | 0.407739 |
| Camarilla | 0.342820 | 0.346230 | 0.349641 | 0.353052 | 0.356463 | 0.359874 | 0.363285 |
| Woodie | 0.297239 | 0.314153 | 0.334448 | 0.351362 | 0.371657 | 0.388571 | 0.408866 |
| Fibonacci | 0.313590 | 0.327804 | 0.336585 | 0.350799 | 0.365013 | 0.373794 | 0.388008 |
| Pivot points | S3 | S2 | S1 | PP | R1 | R2 | R3 |
|---|---|---|---|---|---|---|---|
| Standard | 0.200023 | 0.251723 | 0.312531 | 0.364231 | 0.425039 | 0.476739 | 0.537547 |
| Camarilla | 0.342399 | 0.352713 | 0.363026 | 0.373339 | 0.383652 | 0.393966 | 0.404279 |
| Woodie | 0.204577 | 0.254000 | 0.317085 | 0.366508 | 0.429593 | 0.479016 | 0.542101 |
| Fibonacci | 0.251723 | 0.294701 | 0.321253 | 0.364231 | 0.407209 | 0.433761 | 0.476739 |
Numerical data
The following are the details of the technical indicators and moving averages that were collected to generate this technical analysis:
| RSI (14): | 48.60 | |
| MACD (12,26,9): | 0.0002 | |
| Directional Movement: | 4.256121 | |
| AROON (14): | -28.571428 | |
| DEMA (21): | 0.351979 | |
| Parabolic SAR (0,02-0,02-0,2): | 0.353646 | |
| Elder Ray (13): | -0.000652 | |
| Super Trend (3,10): | 0.348116 | |
| Zig ZAG (10): | 0.350719 | |
| VORTEX (21): | 1.0230 | |
| Stochastique (14,3,5): | 17.20 | |
| TEMA (21): | 0.351321 | |
| Williams %R (14): | -84.07 | |
| Chande Momentum Oscillator (20): | -0.002704 | |
| Repulse (5,40,3): | -0.5479 | |
| ROCnROLL: | 2 | |
| TRIX (15,9): | 0.0322 | |
| Courbe Coppock: | 1.48 |
| MA7: | 0.352548 | |
| MA20: | 0.351077 | |
| MA50: | 0.351734 | |
| MA100: | 0.365316 | |
| MAexp7: | 0.350970 | |
| MAexp20: | 0.351468 | |
| MAexp50: | 0.350698 | |
| MAexp100: | 0.350840 | |
| Price / MA7: | -0.65% | |
| Price / MA20: | -0.23% | |
| Price / MA50: | -0.42% | |
| Price / MA100: | -4.12% | |
| Price / MAexp7: | -0.20% | |
| Price / MAexp20: | -0.35% | |
| Price / MAexp50: | -0.13% | |
| Price / MAexp100: | -0.17% |
About author
Online


Add a comment
Comments
0 comments on the analysis CARDANO - ADA/USD - 1H