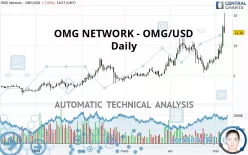
OMG NETWORK - OMG/USD - Daily - Technical analysis published on 05/07/2021 (GMT)
- 249
- 0
Click here for a new analysis!
- Timeframe : Daily
- - Analysis generated on
- Status : INVALID

Summary of the analysis

Additional analysis
Quotes
OMG NETWORK - OMG/USD rating 12.16 USD. On the day, this instrument lost -7.53% and was traded between 12.01 USD and 15.36 USD over the period. The price is currently at +1.25% from its lowest and -20.83% from its highest.So that you have an overall view of the price change, here is a table showing the variations over several periods:
New HIGH record (1 year)
Type : Bullish
Timeframe : Weekly
New HIGH record (1st january)
Type : Bullish
Timeframe : Weekly
New HIGH record (1 month)
Type : Bullish
Timeframe : Weekly
Technical
Technical analysis of OMG NETWORK - OMG/USD in Daily shows a strongly overall bullish trend. The signals given by the moving averages are 92.86% bullish. This strong bullish trend is confirmed by the strong signals currently being given by short-term moving averages. There is no crossing of moving average by the price or crossing of moving averages between themselves.
In fact, 15 technical indicators on 18 studied are currently bullish. But beware of excesses. The Central Indicators scanner currently detects this:
RSI indicator is overbought : over 70
Type : Neutral
Timeframe : Daily
CCI indicator is overbought : over 100
Type : Neutral
Timeframe : Daily
Williams %R indicator is overbought : over -20
Type : Neutral
Timeframe : Daily
Pivot points : price is over resistance 3
Type : Neutral
Timeframe : Weekly
Price is back over the pivot point
Type : Bullish
Timeframe : Daily
An analysis of the price chart with the Central Patterns scanner (detector of chart patterns and resistances and supports) shows several results that can have an impact on the price change:
Horizontal resistance is broken
Type : Bullish
Timeframe : Daily
Resistance of channel is broken
Type : Bullish
Timeframe : Daily
The Central Candlesticks scanner which studies Japanese candlesticks did not detect anything.
| S3 | S2 | S1 | Price | |
|---|---|---|---|---|
| ProTrendLines | 7.70 | 9.32 | 10.40 | 12.16 |
| Change (%) | -36.68% | -23.36% | -14.47% | - |
| Change | -4.46 | -2.84 | -1.76 | - |
| Level | Major | Intermediate | Major | - |
Pivot points can also be used to set your price objectives. Here is the price situation in relation to pivot points:
| Pivot points | S3 | S2 | S1 | PP | R1 | R2 | R3 |
|---|---|---|---|---|---|---|---|
| Standard | 7.10 | 8.35 | 10.75 | 12.00 | 14.40 | 15.65 | 18.05 |
| Camarilla | 12.15 | 12.48 | 12.82 | 13.15 | 13.49 | 13.82 | 14.15 |
| Woodie | 7.68 | 8.64 | 11.33 | 12.29 | 14.98 | 15.94 | 18.63 |
| Fibonacci | 8.35 | 9.74 | 10.61 | 12.00 | 13.39 | 14.26 | 15.65 |
| Pivot points | S3 | S2 | S1 | PP | R1 | R2 | R3 |
|---|---|---|---|---|---|---|---|
| Standard | 4.12 | 4.95 | 6.56 | 7.39 | 9.00 | 9.83 | 11.44 |
| Camarilla | 7.49 | 7.71 | 7.94 | 8.16 | 8.38 | 8.61 | 8.83 |
| Woodie | 4.50 | 5.15 | 6.94 | 7.59 | 9.38 | 10.03 | 11.82 |
| Fibonacci | 4.95 | 5.89 | 6.46 | 7.39 | 8.33 | 8.90 | 9.83 |
| Pivot points | S3 | S2 | S1 | PP | R1 | R2 | R3 |
|---|---|---|---|---|---|---|---|
| Standard | -0.79 | 2.35 | 5.05 | 8.19 | 10.89 | 14.03 | 16.73 |
| Camarilla | 6.13 | 6.67 | 7.21 | 7.74 | 8.28 | 8.81 | 9.35 |
| Woodie | -1.02 | 2.24 | 4.82 | 8.08 | 10.66 | 13.92 | 16.50 |
| Fibonacci | 2.35 | 4.58 | 5.96 | 8.19 | 10.42 | 11.80 | 14.03 |
Numerical data
The following is the status of the technical indicators and moving averages at the time of publication of this technical analysis:
| RSI (14): | 68.38 | |
| MACD (12,26,9): | 0.8400 | |
| Directional Movement: | 32.86 | |
| AROON (14): | 100.00 | |
| DEMA (21): | 9.82 | |
| Parabolic SAR (0,02-0,02-0,2): | 7.58 | |
| Elder Ray (13): | 4.25 | |
| Super Trend (3,10): | 8.83 | |
| Zig ZAG (10): | 12.23 | |
| VORTEX (21): | 1.1000 | |
| Stochastique (14,3,5): | 85.64 | |
| TEMA (21): | 10.40 | |
| Williams %R (14): | -31.45 | |
| Chande Momentum Oscillator (20): | 6.14 | |
| Repulse (5,40,3): | 9.5000 | |
| ROCnROLL: | 1 | |
| TRIX (15,9): | 0.4000 | |
| Courbe Coppock: | 82.78 |
| MA7: | 9.91 | |
| MA20: | 8.20 | |
| MA50: | 7.90 | |
| MA100: | 6.52 | |
| MAexp7: | 10.41 | |
| MAexp20: | 8.97 | |
| MAexp50: | 7.95 | |
| MAexp100: | 6.84 | |
| Price / MA7: | +22.70% | |
| Price / MA20: | +48.29% | |
| Price / MA50: | +53.92% | |
| Price / MA100: | +86.50% | |
| Price / MAexp7: | +16.81% | |
| Price / MAexp20: | +35.56% | |
| Price / MAexp50: | +52.96% | |
| Price / MAexp100: | +77.78% |
About author

Online


Add a comment
Comments
0 comments on the analysis OMG NETWORK - OMG/USD - Daily