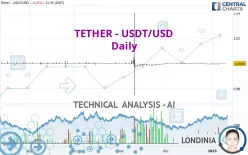
TETHER - USDT/USD - Daily - Technical analysis published on 01/09/2023 (GMT)
- 248
- 0
Click here for a new analysis!
- Timeframe : Daily
- - Analysis generated on
- Status : LEVEL MAINTAINED

Summary of the analysis

Additional analysis
Quotes
The TETHER - USDT/USD rating is 0.999900 USD. The price is lower by -0.01% since the last closing and was traded between 0.999900 USD and 1.000000 USD over the period. The price is currently at 0% from its lowest and -0.01% from its highest.A study of price movements over other periods shows the following variations:
Near a new LOW record (1 year)
Type : Bearish
Timeframe : Weekly
New HIGH record (1st january)
Type : Bullish
Timeframe : Weekly
Near a new HIGH record (1 month)
Type : Bullish
Timeframe : Weekly
Technical
Technical analysis of this Daily chart of TETHER - USDT/USD indicates that the overall trend is strongly bullish. 92.86% of the signals given by moving averages are bullish. This strongly bullish trend is supported by the strong bullish signals given by short-term moving averages. The Central Indicators market scanner is currently detecting several bullish signals that could impact this trend:
Moving Average bullish crossovers : MA50 & MA100
Type : Bullish
Timeframe : Daily
Moving Average bullish crossovers : AMA50 & AMA100
Type : Bullish
Timeframe : Daily
The probability of a further increase is high given the direction of the technical indicators.
Caution: the Central Indicators scanner currently detects an excess:
Williams %R indicator is overbought : over -20
Type : Neutral
Timeframe : Daily
MACD indicator is back over 0
Type : Bullish
Timeframe : Daily
No signals are given by Central Patterns, a market scanner specialised in chart patterns, resistances and supports.
There is also a Japanese candlestick pattern detected by Central Candlesticks that could mark the end of the current short-term trend:
Doji
Type : Neutral
Timeframe : Daily
| S3 | S2 | S1 | Price | R1 | R2 | R3 | |
|---|---|---|---|---|---|---|---|
| ProTrendLines | 0.998411 | 0.998900 | 0.999450 | 0.999900 | 1.000000 | 1.001000 | 1.002000 |
| Change (%) | -0.15% | -0.10% | -0.05% | - | +0.01% | +0.11% | +0.21% |
| Change | -0.001489 | -0.001000 | -0.000450 | - | +0.000100 | +0.001100 | +0.002100 |
| Level | Minor | Intermediate | Major | - | Major | Major | Major |
To determine price objectives, it is also possible to use the pivot points. Here is the price position in relation to pivot points:
| Pivot points | S3 | S2 | S1 | PP | R1 | R2 | R3 |
|---|---|---|---|---|---|---|---|
| Standard | 0.999667 | 0.999733 | 0.999867 | 0.999933 | 1.000067 | 1.000133 | 1.000267 |
| Camarilla | 0.999945 | 0.999963 | 0.999982 | 1.000000 | 1.000018 | 1.000037 | 1.000055 |
| Woodie | 0.999700 | 0.999750 | 0.999900 | 0.999950 | 1.000100 | 1.000150 | 1.000300 |
| Fibonacci | 0.999733 | 0.999810 | 0.999857 | 0.999933 | 1.000010 | 1.000057 | 1.000133 |
| Pivot points | S3 | S2 | S1 | PP | R1 | R2 | R3 |
|---|---|---|---|---|---|---|---|
| Standard | 0.998933 | 0.999167 | 0.999533 | 0.999767 | 1.000133 | 1.000367 | 1.000733 |
| Camarilla | 0.999735 | 0.999790 | 0.999845 | 0.999900 | 0.999955 | 1.000010 | 1.000065 |
| Woodie | 0.999000 | 0.999200 | 0.999600 | 0.999800 | 1.000200 | 1.000400 | 1.000800 |
| Fibonacci | 0.999167 | 0.999396 | 0.999538 | 0.999767 | 0.999996 | 1.000138 | 1.000367 |
| Pivot points | S3 | S2 | S1 | PP | R1 | R2 | R3 |
|---|---|---|---|---|---|---|---|
| Standard | 0.997533 | 0.998467 | 0.999133 | 1.000067 | 1.000733 | 1.001667 | 1.002333 |
| Camarilla | 0.999360 | 0.999507 | 0.999653 | 0.999800 | 0.999947 | 1.000093 | 1.000240 |
| Woodie | 0.997400 | 0.998400 | 0.999000 | 1.000000 | 1.000600 | 1.001600 | 1.002200 |
| Fibonacci | 0.998467 | 0.999078 | 0.999456 | 1.000067 | 1.000678 | 1.001056 | 1.001667 |
Numerical data
The following is the status of technical indicators and moving averages registered at the time this technical analysis was created:
| RSI (14): | 56.69 | |
| MACD (12,26,9): | 0.0000 | |
| Directional Movement: | 13.220520 | |
| AROON (14): | -78.571429 | |
| DEMA (21): | 0.999830 | |
| Parabolic SAR (0,02-0,02-0,2): | 0.979073 | |
| Elder Ray (13): | 0.000117 | |
| Super Trend (3,10): | 1.000336 | |
| Zig ZAG (10): | 1.000000 | |
| VORTEX (21): | 1.0000 | |
| Stochastique (14,3,5): | 94.44 | |
| TEMA (21): | 0.999833 | |
| Williams %R (14): | 0.00 | |
| Chande Momentum Oscillator (20): | 0.000300 | |
| Repulse (5,40,3): | 0.0302 | |
| ROCnROLL: | 1 | |
| TRIX (15,9): | -0.0002 | |
| Courbe Coppock: | 0.01 |
| MA7: | 0.999829 | |
| MA20: | 0.999825 | |
| MA50: | 0.999784 | |
| MA100: | 0.999778 | |
| MAexp7: | 0.999874 | |
| MAexp20: | 0.999834 | |
| MAexp50: | 0.999803 | |
| MAexp100: | 0.999776 | |
| Price / MA7: | +0.01% | |
| Price / MA20: | +0.01% | |
| Price / MA50: | +0.01% | |
| Price / MA100: | +0.01% | |
| Price / MAexp7: | +0.00% | |
| Price / MAexp20: | +0.01% | |
| Price / MAexp50: | +0.01% | |
| Price / MAexp100: | +0.01% |
About author
Online


Add a comment
Comments
0 comments on the analysis TETHER - USDT/USD - Daily