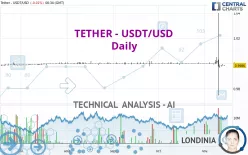
TETHER - USDT/USD - Daily - Technical analysis published on 11/14/2022 (GMT)
- 259
- 0
- Timeframe : Daily
- - Analysis generated on
- Status : WITHOUT TARGET

Summary of the analysis

Additional analysis
Quotes
The TETHER - USDT/USD price is 0.998600 USD. The price is lower by -0.01% since the last closing and was between 0.998600 USD and 0.998800 USD. This implies that the price is at 0% from its lowest and at -0.02% from its highest.The Central Gaps scanner detects a bearish opening. A small advantage for sellers in the very short term.
Bearish opening
Type : Bearish
Timeframe : Openning
Here is a more detailed summary of the historical variations registered by TETHER - USDT/USD:
Near a new LOW record (1 year)
Type : Bearish
Timeframe : Weekly
Near a new HIGH record (1 month)
Type : Bullish
Timeframe : Weekly
Abnormal volumes on TETHER - USDT/USD were detected by the Central Volumes scanner:
Abnormal volumes
Timeframe : 5 days
Technical
Technical analysis of TETHER - USDT/USD in Daily shows an overall bearish trend. The signals given by moving averages are at 64.29% bearish. This bearish trend shows slight signs of slowing down given the slightly bearish signals of short-term moving averages. There is no crossing of moving average by the price or crossing of moving averages between themselves.
An assessment of technical indicators does not currently provide any relevant information to suggest whether the signal given by the technical indicators is more bullish or bearish.
Caution: the Central Indicators scanner currently detects an excess:
CCI indicator is oversold : under -100
Type : Neutral
Timeframe : Daily
An analysis of the price chart with the Central Patterns scanner (detector of chart patterns and resistances and supports) shows a result that can have an impact on the price change:
Near horizontal resistance
Type : Bearish
Timeframe : Daily
The Central Candlesticks scanner currently notes the presence of this pattern in Japanese candlesticks that could mark the end of the short-term trend currently underway:
Doji
Type : Neutral
Timeframe : Daily
| Price | R1 | R2 | |
|---|---|---|---|
| ProTrendLines | 0.998600 | 1.000000 | 1.010000 |
| Change (%) | - | +0.14% | +1.14% |
| Change | - | +0.001400 | +0.011400 |
| Level | - | Intermediate | Intermediate |
To determine price objectives, it is also possible to use the pivot points. Here is the price position in relation to pivot points:
| Pivot points | S3 | S2 | S1 | PP | R1 | R2 | R3 |
|---|---|---|---|---|---|---|---|
| Standard | 1.000000 | 1.000000 | 1.000000 | 1.000000 | 1.000000 | 1.000000 | 1.000000 |
| Camarilla | 1.000000 | 1.000000 | 1.000000 | 1.000000 | 1.000000 | 1.000000 | 1.000000 |
| Woodie | 1.000000 | 1.000000 | 1.000000 | 1.000000 | 1.000000 | 1.000000 | 1.000000 |
| Fibonacci | 1.000000 | 1.000000 | 1.000000 | 1.000000 | 1.000000 | 1.000000 | 1.000000 |
| Pivot points | S3 | S2 | S1 | PP | R1 | R2 | R3 |
|---|---|---|---|---|---|---|---|
| Standard | 0.896667 | 0.933333 | 0.966667 | 1.003333 | 1.036667 | 1.073333 | 1.106667 |
| Camarilla | 0.980750 | 0.987167 | 0.993583 | 1.000000 | 1.006417 | 1.012833 | 1.019250 |
| Woodie | 0.895000 | 0.932500 | 0.965000 | 1.002500 | 1.035000 | 1.072500 | 1.105000 |
| Fibonacci | 0.933333 | 0.960073 | 0.976593 | 1.003333 | 1.030073 | 1.046593 | 1.073333 |
| Pivot points | S3 | S2 | S1 | PP | R1 | R2 | R3 |
|---|---|---|---|---|---|---|---|
| Standard | 1.000000 | 1.000000 | 1.000000 | 1.000000 | 1.000000 | 1.000000 | 1.000000 |
| Camarilla | 1.000000 | 1.000000 | 1.000000 | 1.000000 | 1.000000 | 1.000000 | 1.000000 |
| Woodie | 1.000000 | 1.000000 | 1.000000 | 1.000000 | 1.000000 | 1.000000 | 1.000000 |
| Fibonacci | 1.000000 | 1.000000 | 1.000000 | 1.000000 | 1.000000 | 1.000000 | 1.000000 |
Numerical data
The following is the status of the technical indicators and moving averages at the time of publication of this technical analysis:
| RSI (14): | 42.27 | |
| MACD (12,26,9): | 0.0000 | |
| Directional Movement: | 44.380000 | |
| AROON (14): | 0 | |
| DEMA (21): | 1.000000 | |
| Parabolic SAR (0,02-0,02-0,2): | 1.040000 | |
| Elder Ray (13): | -0 | |
| Super Trend (3,10): | 1.010000 | |
| Zig ZAG (10): | 1.000000 | |
| VORTEX (21): | 0.9600 | |
| Stochastique (14,3,5): | 36.41 | |
| TEMA (21): | 1.000000 | |
| Williams %R (14): | -63.59 | |
| Chande Momentum Oscillator (20): | 0.000000 | |
| Repulse (5,40,3): | -0.4200 | |
| ROCnROLL: | 2 | |
| TRIX (15,9): | 0.0000 | |
| Courbe Coppock: | 0.13 |
| MA7: | 1.000000 | |
| MA20: | 1.000000 | |
| MA50: | 1.000000 | |
| MA100: | 1.000000 | |
| MAexp7: | 1.000000 | |
| MAexp20: | 1.000000 | |
| MAexp50: | 1.000000 | |
| MAexp100: | 1.000000 | |
| Price / MA7: | -0.14% | |
| Price / MA20: | -0.14% | |
| Price / MA50: | -0.14% | |
| Price / MA100: | -0.14% | |
| Price / MAexp7: | -0.14% | |
| Price / MAexp20: | -0.14% | |
| Price / MAexp50: | -0.14% | |
| Price / MAexp100: | -0.14% |
About author
Online


Add a comment
Comments
0 comments on the analysis TETHER - USDT/USD - Daily